
Icons of ID: Avida and Common descent
The evidence for common descent, which is a logical prediction from Darwinian descent is quite extensive.
Douglas Theobald presents an excellent outline of the argument at 29+ Evidences for Macroevolution The Scientific Case for Common Descent
I will show how simple experiment with digital and real DNA both recapture the expected nested hierarchies and phylogenies. I hope this may resolve some of the confusions about Darwinian evolution, common descent, phylogenetic reconstruction based on DNA and nested hierarchies. So in other words, while Darwinian evolution leads inevitably to a nested hierarchy, such phylogeny may not always be recoverable using DNA.
Using Avida to Test the Effects of Natural Selection on Phylogenetic Reconstruction Methods
We find that if the organisms undergo natural selection between branch points, the methods will be successful even on very large time scales. However these algorithms often falter when selection is absent.
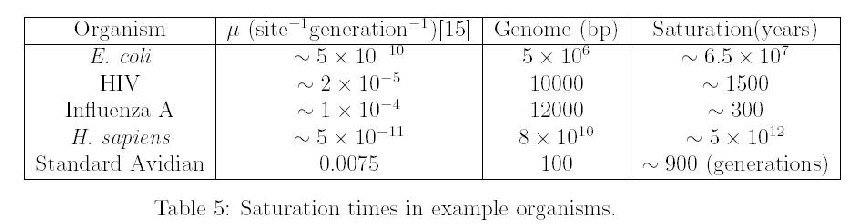
Saturation
If one were to graph the number of DNA differences as function of time since speciation, it will eventually show a flattening as DNA differences lose their phylogenetic relevance because when saturation is reached the DNA differences reflect as much common ancestry as it does chance convergence. Neutral DNA will saturate faster than non-neutral DNA so the question is how long does it take for neutral DNA to become saturated?

So for recovering ancient common ancestry we need a long, slowly evolving gene since saturation is both a function of mutation rate and size of the genome involved. But such genes are unsuitable for measuring recent events. So just like radiometric dating we need genes of different sizes and different mutation rates.
Saturation can interfere with the ability to reconstruct a reliable phylogeny and one can estimate the time required for saturation to affect the phylogenetic reconstruction. For short genomes and high mutation rates, it is not surprising that phylogenetic reconstruction becomes an issue. Note that there is still a nested hierarchy just that this cannot be reconstructed from phylogenetic data. Some have confused the inability to use phylogenetic reconstruction with an actual absence of nested hierarchies.
In Experimental Phylogeny of Neutrally Evolving DNA Sequences Generated by a Bifurcate Series of Nested Polymerase Chain Reactions Sanson et al describe an interesting experiment. They create a known phylogeny using a four step method leading to 16 terminal sequences. They then applied phylogenetic reconstruction methods to see how accurately they could reconstruct the true phylogeny.

Fig. 1.–Evolution of DNA sequences by a series of bifurcate PCRs. An ancestor SSU rDNA cloned in pBluescript was used as template for series 1 of 70 nested PCR cycles with M13 primers. After the initial 35 cycles, reaction products were diluted 1:1,000 and used as templates for the subsequent 35 cycles, with rDNA primers RIBA and RIBB. After 70 cycles amplicons were cloned, and two clones were picked randomly and used as templates for the next series of nested PCR cycles. Lineages are propagated at random, and therefore the evolution is neutral and behaves as a stochastic process. Tree nodes T1 to T16 indicate terminal sequences, and 1.1 to 4.8, internal ancestors
The following picture describes the reconstruction and shows how the reconstructed phylogeny and the actual phylogenetic tree are identical.

Fig. 3.–Comparison of real phylogeny with inferred maximum likelihood phylogeny (Felsenstein 1981 ; Posada and Crandall 1998 ; Swofford 1998 ). The serial PCR in vitro evolution resulted in the topology depicted (A) with varying branch lengths whose ancestors (1.1 to 4.8, circled) and terminal sequences (T1 to T16) were sequenced in full length. Scale bar indicates the number of cycles between tree internodes and nodes. The inferred phylogeny (B) has a topology identical to the real tree (A) and 9 out of 30 branch lengths were estimated correctly. Boxed numbers indicate branch lengths (number of substitutions), numbers in italics represent the percentage of a given cluster in 100 bootstrap replicates, with reestimation of parameters at each bootstrap replicate (top), and without reestimation at each replicate (bottom). Numbers below arrows indicate the estimated divergence (cycles ago), with the low-high confidence interval range (in parenthesis) as calculated by maximum likelihood quartet analysis (Rambaut and Bromham 1998 ). Numbers of substitutions, with corresponding standard errors, in the inferred tree (B) were calculated by multiplying the branch lengths (in substitutions per site) by the total number of positions (2,238 bp)
The authors then go on to reconstruct the ancestral states and present this interesting picture

Fig. 4.–Comparison between ancestor sequences in the real phylogeny (fig. 3A ) and maximum likelihood reconstruction of ancestral states, HA. Only polymorphic positions are shown. Dots indicate residues identical to sequence 1.1. Numbers above the alignment indicate the position numbers. Numbers in parenthesis indicate the differences between the HA and their corresponding real ancestor sequences
Phylogenetic Inferences from Molecular Sequences: Review and Critique provides a good overview of the issues surrounding phylogenetic reconstruction and its problems and assumptions.
Another good paper is “EVOLUTION, WEIGHTING, AND PHYLOGENETIC UTILITY OF MITOCHONDRIAL GENE-SEQUENCES AND A COMPILATION OF CONSERVED POLYMERASE CHAIN-REACTION PRIMERS” by SIMON C, FRATI F, BECKENBACH A, CRESPI B, LIU H, FLOOK P in ANNALS OF THE ENTOMOLOGICAL SOCIETY OF AMERICA
Abstract: DNA-sequence data from the mitochondrial genome are being used with increasing frequency to estimate phylogenetic relationships among animal taxa. The advantage to using DNA-sequence data is that many of the processes governing the evolution and inheritance of DNA are already understood. DNA data, however, do not guarantee the correct phylogenetic tree because of problems associated with shared ancestral polymorphisms and multiple substitutions at single nucleotide sites. Knowledge of evolutionary processes can be used to improve estimates of patterns of relationships and can help to assess the phylogenetic usefulness of individual genes and nucleotides. This article reviews molecular processes, discusses the correction of genetic distances and the weighting of DNA data, and provides an assessment of the phylogenetic usefulness of specific mitochondrial genes. The Appendix presents a compilation of conserved polymerase chain reaction primers that can be used to amplify virtually any gene in the mitochondrial genome. DNA data sets vary tremendously in degree of phylogenetic usefulness. Correction or weighting (or both) of DNA-sequence data based on level of variability can improve results in some cases. Gene choice is of critical importance. For studies of relationships among closely related species, the use of ribosomal genes can be problematic, whereas unconstrained sites in protein coding genes appear to have fewer problems. In addition, information from studies of amino acid substitutions in rapidly evolving genes may help to decipher close relationships. For intermediate levels of divergence where silent sites contain many multiple hits, amino acid changes can be useful for construction phylogenetic relationships. For deep levels of divergence, protein coding genes may be saturated at the amino acid level and highly conserved regions of ribosomal RNA and transfer RNA genes may be useful. Because of the arbitrariness of taxonomic categories, no sweeping generalizations can be made about the taxonomic rank at which particular genes are useful. As more DNA-sequence data accumulate, we will be able to gain an even better understanding of the way in which genes and species evolve.