
Icons of ID: Avida
Intelligent design proponents have raised a myriad of criticisms against the Avida experiments, most of these criticisms miss the point. For instance, the claim that Avida does not accurately model biological evolution. But there are some claims that deserve a closer look. Since I am very interested in these issues, I will address a few of them.
Statistically insignificant sequence space distances are assumed between novel, more complex functions. This is an artefact of logic functions and not protein sequence.
So what is the nature of sequence space?
Peter Schuster and various of his colleagues have done a lot of work studying RNA and have shown that
Relevant concepts involve the genotype-phenotype mapping. Since phenotypes are not varied directly but rather indirectly, the nature of the mapping between the sequences and the phenotype are important for understanding how evolution works.
The problem is that genotype-phenotype mappings are in general non-trivial. For this reason researchers have used the more manageable problem of RNA folding from sequences to secondary structures.
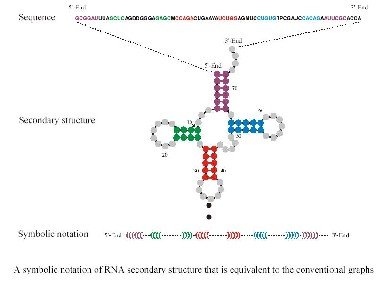
Adapted from Inverse Folding and Sequence-Structure Maps of Ribonucleic Acids by Peter Schuster
Simulated populations of replicating and mutating sequences under selection exhibit many phenomena known from organismal evolution: neutral drift, punctuated change, plasticity, environmental and genetic canalization, and the emergence of modularity, see e.g. [13-18]. Laboratory experiments have also generated phenomena consistent with these patterns [19-21].
Genotype space
Genotype space (sequence space) is fully determined by genetic operators such as mutation, recombination, duplication, genome rearrangement and many others. For point mutations once can look at genomes which differ by a single nucleotide. These genomes are ‘neighbors’ in sequence space. Schuster and Stadler have used graph representations to map sequence space. It is important to realize that different genetic operators have different ‘neighborhood’ space topologies.
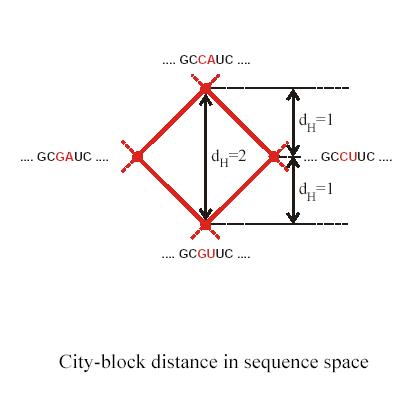
Let’s first define ‘Hamming distance’ for single nucleotide mutations
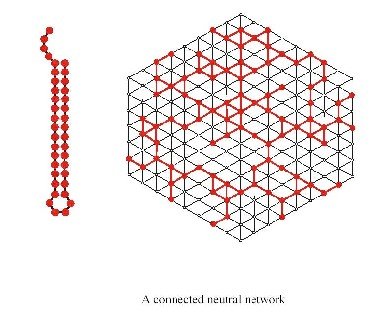
Let’s look at an example of a neutral network for a particular common structure:
Phenotype space
Phenotype space is where natural selection can act. How accessible this phenotype space is, is determined by the accessibility of the genotype space and the genotype to phenotype mapping.
RNA makes for a very suitable candidate for theoretical and empirical evaluations of these concepts since RNA can act as a genotype and phenotype and using SELEX experiments one can validate theoretical findings. In addition secondary structures of RNA are computationally feasible making an evaluation of theoretical concepts accessible.
The first thing one notices when looking at the genotype to phenotype (GP) map is redundancy. In other words there are many more genotypes than phenotypes or in case of RNA many more sequences than structures. Based on the genotype and phenotype, one can determine so called neutral maps, which indicate which mutations lead to sequences with the same phenotype (secondary structure). Such maps are invaluable in understanding the various aspects of evolution.
Fitness and fitness landscapes
Common representations of fitness landscapes show a two or three dimensional picture of mountains and valleys. However fitness landscape in case of RNA is not a single line but a neighborhood in sequence space.
Evolutionary trajectories
An evolutionary trajectory is a function of time of the phenotype space. Using RNA simulations it has been shown how these evolutionary trajectories show patterns of ‘stasis’ followed by intermittent bursts of adaptive evolution. In fact, these patterns seem to mimic the patterns found in the fossil record (remember that fossils represent a record of phenotype not genotype) and is consistent with experimental data. As I have shown elsewhere, neutral space becomes an important factor in evolvability.
The preceding text was adapted from ‘The Topology of Evolutionary Biology” by Barbel M. R. Stadler and Peter F. Stadler
Now we move on to “Networks in Molecular Evolution” by PETER SCHUSTER and PETER F. STADLER
Neutral networks in sequence space explain the evolvability of both nucleic acids and polypeptides by linking Darwinian selection with neutral drift. Interacting replicators, be they simple molecules or highly complex mammals, form intricate ecological networks that are crucial for their survival. Chemical reactions are collected in extensive metabolic networks by means of specific enzymes; both the enzymes and the chemical reaction network that they govern undergoes evolutionary changes. Networks of gene regulation, protein-protein interaction, and cell signaling form the physico-chemical basis for morphogenesis and development. The nervous systems of higher animals form another distinct level of network architecture. We are beginning to understand the structure and function of each of the individual levels in some detail. Yet, their interplay largely remains still in the dark.
Four properties of the RNA map were derived (scale free networks):
- There are many more sequences than structures.
- There are very few common and many uncommon structures
- The distribution of neutral genotypes (sequences that fold into the same structure) is approximately random in sequence space. This means that it is possible to define a spherical region with a diameter much smaller than the diameter of sequence space which contains on the average for every common structure at least one sequence that folds into it.
- Existence and connectivity of neutral networks. That is, any neutral network is within a close distance of another common neutral network.
Of these properties it can be shown that the first, second and fourth one seem to hold for protein space.
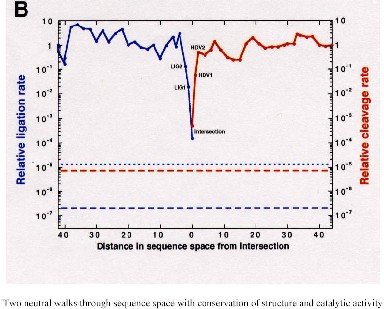
Sequences at the intersection of the compatible sets of two neutral networks upon the same sequence space were found to be of actual interest since they can simultaneously carry the properties of the different RNA folds. For example, they can exhibit catalytic activities of two ribozymes [43]. …
Analogous results were reported for proteins. Computational studies predict the existence of neutral networks and shape space covering also for polypeptides [2, 3]. So far, these predictions are in agreement with experiments(see, for example, [36]).
(36) A. D. Keefe and J. W. Szostak. Functional proteins from a random-sequence library. Nature, 410:715{718, 2001.
(43) E. A. Schultes and D. P. Bartel. One sequence, two ribozymes: Implications for the emergence of new ribozyme folds. Science, 289:448{452, 2000.
Protein networks
Scale-Free Behavior in Protein Domain Networks Stefan Wuchty
Several technical, social, and biological networks were recently found to demonstrate scale-free and small-world behavior instead of random graph characteristics. In this work, the topology of protein domain networks generated with data from the ProDom, Pfam, and Prosite domain databases was studied. It was found that these networks exhibited small-world and scale-free topologies with a high degree of local clustering accompanied by a few longdistance connections. Moreover, these observations apply not only to the complete databases, but also to the domain distributions in proteomes of different organisms. The extent of connectivity among domains reflects the evolutionary complexity of the organisms considered.
Especially
Evolving protein interaction networks through gene duplication Romualdo Pastor-Satorras, Eric Smith, RicardV. Sol!ec, Journal of Theoretical Biology 222 (2003) 199-210
The topology of the proteome map revealed by recent large-scale hybridization methods has shown that the distribution of protein-protein interactions is highly heterogeneous, with many proteins having few edges while a few of them are heavily connected. This particular topology is shared by other cellular networks, such as metabolic pathways, and it has been suggested to be responsible for the high mutational homeostasis displayed by the genome of some organisms. In this paper we explore a recent model of proteome evolution that has been shown to reproduce many of the features displayed by its real counterparts. The model is based on gene duplication plus re-wiring of the newly created genes. The statistical features displayed by the proteome of well-known organisms are reproduced and suggest that the overall topology of the protein maps naturally emerges from the two leading mechanisms considered by the model.