
Theory is as Theory Does.
by Ian F. Musgrave, Steve Reuland, and Reed A. Cartwright
“There’s precious little real biology in this project,” Mr. Behe said. For example, he said, the results might be more persuasive if the simulations had operated on genetic sequences rather than fictitious computer programs.
Michael J. Behe was commenting in The Chronicle of Higher Education (Kiernan 2003) on a paper reporting that digital organisms could evolve irreducibly complex systems without intervention (Lenski et al. 2003). Ironically, Behe has just coauthored a theoretical paper with David W. Snoke on the evolution of complex molecular adaptations that has “precious little real biology” in it. William Dembski has already stated that Behe and Snoke’s research “may well be the nail in the coffin [and] the crumbling of the Berlin wall of Darwinian evolution” (Dembski 2004). Despite the common claim made by “intelligent design” activists that evolution is in trouble, they have so far been unsuccessful in presenting their arguments to the scientific community. Is this the long-awaited peer-reviewed publication which will finally do it?
No.
Although some in the “intelligent design” community tout Behe and Snoke’s paper as the long-awaited theoretical paper (Discovery Institute 2004), it contains no “design theory”, makes no attempt to model an “intelligent design” process, and proposes no alternative to evolution. In reality Behe & Snoke (2004) is an unmemorable investigation of neutral drift in protein and nucleic acid sequences. As we will show, the paper cannot even support the modest claims it does make.
Behe has argued that certain biochemical systems or structures have a property he calls “irreducible complexity” (Behe 1996). Irreducible complexity is an update on the old anti-evolutionist argument of “What good is half a wing?” Simply put, the idea is that all the components of a system must be present before the system can accomplish its current function, and, therefore, there is no gradual, step-by-step way for natural selection to construct the system being considered. Behe’s arguments have attracted significant criticism, and Behe has recast his definition of “irreducible complexity” from time to time to attempt to deal with these criticisms. One of these re-definitions of “irreducible complexity” introduces the notion of unavoidable gaps in a stepwise progression of adaptive evolutionary intermediates of a system, such that the only means of bridging the gap is via neutral evolution (Behe 2000). The current paper is apparently an attempt to quantify just how improbable this process of bridging gaps via neutral mutation might be, and thus we may expect that when Behe makes arguments along these lines in the future he will point to this paper as the justification for saying that evolution does not have the time available to fashion “irreducibly complex” structures.
Although Behe and Snoke are “skeptical” of the ability of “Darwinian processes” to account for the evolution of complex biochemical systems (Behe & Snoke 2004), there is substantial scientific evidence for the conclusion that complex biochemical systems can and have evolved on earth. There is direct experimental research (Hall 2003). There are observed instances of it occurring in nature (Copley 2000, Seffernick & Wackett 2001, Johnson et al. 2002). There is also much evidence from comparative studies (Melendez-Hevia et al. 1996, Cunchillos & Lecointre 2003 as two examples). However, we don’t have enough space to fully explore the large amount of data that Behe and Snoke’s “skepticism” must overcome. We have our hands full just explaining some of the manifold ways in which Behe and Snoke’s model fails to represent molecular evolution. The flavor of Behe and Snoke’s paper may be gauged by the fact that the authors are skeptical of Darwinian processes to produce complex structures, yet use a model which largely ignores Darwinian processes. In the following sections we will examine some of the more questionable aspects of Behe and Snoke’s paper.
One True Sequence?
Theory is rather hard to review, and it is not uncommon for problematic theory to get published. For this reason, post-publication review is very important to sifting good theory from bad. We cannot emphasize this enough. The theoretician among us only trusts theory that either has withstood the test of time or has been satisfactorily replicated by him. (This paper satisfies neither.) There are two issues in creating good theory: (1) getting the modeling right and (2) using assumptions relevant to nature. Sometimes the former dooms theory, but in most instances it is the latter. We believe there are some issues with the modeling in the paper, but investigating them is too complex for this essay. However, even a rough reading of the paper makes it clear that Behe and Snoke’s work and the conclusions they draw are not relevant to nature.
Behe and Snoke are attempting to estimate how long and how large of a population it would take for a protein in the absence of selection to evolve a new binding site or other complex feature. They assume up-front that multiple amino acid substitutions would be required before the new feature can be preserved by natural selection. They call this a “multiresidue” feature (MR).
Behe and Snoke are modeling the formation of a completely new binding site in a duplicated protein. While this process is important in generating some kinds of new function, in the majority of duplicated proteins, existing binding sites are either modified to act on new substrates (for example the expansion of the protein kinase (Manning et al. 2002, Caenepeel et al. 2004, Waterston et al. 2002) and G-protein coupled receptor families in vertebrates) or new catalytic mechanisms (the TIM family of proteins; Schmidt et al. 2003, Gerlt & Babbitt 2001). (See Musgrave 2003 for more discussion about the evolution of binding sites. See Musgrave 2004 for a discussion on disulfide bonds.) Duplication of enzymes and modification of their existing binding sites can produce quite complex pathways; for example the clotting cascade is due to duplication of proteolytic enzymes with a subsequent change in substrates (Miller 1999 and the references therein).
Behe and Snoke use five parameters to model the neutral evolution of their sequences: the number of mutations needed for the multi-residue feature (λ), the ratio of null mutations (ones that create a pseudogene) to needed mutation (ρ), the number of duplicate genes in the population (N), the selection coefficient of the multi-residue feature (s), and the instantaneous rate of point mutation per site (ν). (Contrary to what Behe and Snoke claim, ν is not a per generation rate of nucleotide mutation.) In the model, selection only acts upon a duplicate gene’s multi-residue feature when it has acquired the particular λ “compatible” mutations and none of the λρ mutations that would nullify it. Behe and Snoke implement nullification by assuming that the duplication is deleted when the first “compatible” mutation (forward or backward) occurs after the first null mutation occurs. The deleted duplication is instantly replaced by a new gene that has no compatible and no null mutations. We call this “reset on null.” After a bit of math and some simulations Behe and Snoke estimate the average time to first appearance (Tf) and the average time to fixation (Tfx) of a multi-residue trait under various parameter sets. They use these results to conclude that point mutations plus selection cannot explain the evolution of multi-residue traits.
However, the model has many restrictive assumptions that prevent it from supporting the conclusion that Behe and Snoke make. In reality, the paper says that if you have a protein function that requires two or more specific mutations in specific locations in a specific gene in a specific population, and if the function is not able to be acted on by natural selection until all mutations are in place and if the only form of mutation is point mutation, and if the population of organisms is asexual, then it will take a very large population and very long time to evolve that function. This is not unexpected.
Furthermore, this paper follows the fallacious fascination with the “one true sequence” that is popular in the “intelligent design” community (for example Meyer 2004). Behe and Snoke end their paper with the following conclusion:
Although large uncertainties remain, it nonetheless seems reasonable to conclude that, although gene duplication and point mutation may be an effective mechanism for exploring closely neighboring genetic space for novel functions, where single mutations produce selectable effects, this conceptually simple pathway for developing new functions is problematic when multiple mutations are required. Thus, as a rule, we should look to more complicated pathways, perhaps involving insertion, deletion, recombination, selection of intermediate states, or other mechanisms, to account for most [multi-residue] protein features.
Behe & Snoke 2004 p11
No matter how much Behe and Snoke want to make this conclusion, it is simply not warranted by any work presented in the paper. The evolution of new functions is not a process that requires a certain target to be hit. There can be multiple new functions that any starting protein can acquire. Likewise, there can be multiple ways of acquiring any given function. And finally, evolution doesn’t happen in a single population; it happens in multiple populations at the same time.
Calculating that it would take a long time for a specific new function to evolve from a specific gene with a specific set of mutations in a specific population in no way suggests that it would take a long time for any new function to evolve in any gene from any set of mutations in any population. Behe and Snoke’s work attempts to show the former, but in their discussion they conclude the latter. Their conclusion simply does not follow.
Behe and Snoke do mention this early in their discussion:
. . . because the simulation looks for the production of a particular MR feature in a particular gene, the values will be overestimates of the time necessary to produce some MR feature in some duplicated gene. In other words, the simulation takes a prospective stance, asking for a certain feature to be produced, but we look at modern proteins retrospectively. Although we see a particular disulfide bond or binding site in a particular protein, there may have been several sites in the protein that could have evolved into disulfide bonds or binding sites, or other proteins may have fulfilled the same role. For example, Matthews’ group engineered several nonnative disulfide bonds into lysozyme that permit function (Matsumura et al. 1989). We see the modern product but not the historical possibilities.
Behe & Snoke 2004 p11, emphasis original
Unfortunately Behe and Snoke ignore their own caveat in the rest of their discussion, resulting in an entirely unjustified conclusion. At the very least, it biases their estimates of population sizes and generations considerably upward. A more realistic scenario, in which multiple targets could be reached, would result in a much smaller number of generations and/or smaller required population sizes. (To be fair, it would be more difficult to model such a scenario.) At worst, the fact that they only consider specific changes at specific locations makes their model meaningless because it assumes a fundamentally different process than the one that occurs in nature.
The rest of this essay will be divided into two parts. The first part will explore the assumptions that Behe and Snoke use to build their model, and why those assumptions bias their model toward their favored conclusion. The second part will discuss the likelihood of MR features evolving, and will include a calculation for Behe and Snoke’s flagship example using realistic parameters.
Evolution of DPG Binding
Let us now look at one of Behe and Snoke’s own examples, the evolution of β-hemoglobin’s 2,3-diphosphoglycerate binding site. Hemoglobin is the protein that caries oxygen in vertebrate blood. In most vertebrates, hemoglobin is a tetramer composed of two α and two β protein chains. There is much evidence that the α and β chains evolved from duplicates of an ancestral globin chain (Li 1997 pp289-292). In mammals, frogs, and reptiles there is a small pocket which binds the organic phosphate molecule 2,3-diphosphoglycerate (DPG) at the interface between the two beta chains. (Reptiles use inositol pentaphosphate (IPP) as the physiological modulator, but their site binds DPG very effectively.) If a molecule of DPG is bound to hemoglobin, it helps stabilize the tetramer, reducing the hemoglobin’s affinity for oxygen. Therefore, DPG regulation allows hemoglobin to release more oxygen in capillaries. DPG is produced by a shunt pathway that prevents glycolysis (the pathway that “burns” glucose to produce energy) from producing the energy molecule ATP when levels of ATP are high. This means that DPG levels are positively correlated with the oxygen levels. When oxygen levels are high, ATP levels are high, and DPG levels are also high. When oxygen levels are low, ATP levels are low, and DPG levels are also low. Therefore, low levels of oxygen favor increased oxygen affinity of hemoglobin. In sum, DPG regulation ensures that hemoglobin can work efficiently even when oxygen levels are low.
Behe and Stoke refer to DPG binding as an example of a function that must have involved multiple neutral mutations, citing Li (1997). At the beginning of their discussion, Behe and Stoke state:
Some features of proteins, such as disulfide bonds and ligand binding sites, . . . are composed of multiple amino acid residues. As Li (1997) points out, the evolutionary origins of such features must have involved multiple mutations that were initially neutral with respect to the MR feature.
Behe & Snoke 2004 p7, emphasis added
However, this is simply not supported by Li (1997):
The emergence of a new function in a DNA or protein sequence is supposedly advantageous and is commonly believed to have occurred by advantageous mutations. However, acquiring a new function may require many mutational steps, and a point that needs emphasis is that the early steps might have been selectively neutral because the new function might not be manifested until a certain number of steps had already occurred.
Li 1997 p427, emphasis added
Note the change from “might have been” to “must have involved.” Li (1997) in fact never says early mutational steps “must have been.” He points out that at least one mutation to form the DPG binding site was selectable, the one that generated histidine at position 2. He also says “Of course one cannot rule out the possibility that either Lys82 or His143 or both have evolved because of a selective advantage other than DPG binding” (p 428). As we shall see below, this is in fact the case. Behe and Snoke overemphasize must, creating a misleading impression that there is authoritative support for the concept that all amino acids of a site must be in place for a selectable function to occur. This is exactly the opposite of current knowledge. It is interesting to point out that in their introduction Behe and Snoke actually quote from this section of Li (1997), yet manage to misread it.
As Li (1997) noted, the binding site for diphosphoglycerate in hemoglobin requires three residues. The population size required to produce an MR feature consisting of three interacting residues by point mutation in a duplicated gene initially lacking those residues would depend on the number of nucleotides that had to be changed–a minimum of three and a maximum of nine.
Behe & Snoke 2004 p10
This gives the misleading impression that Li (1997) states that the DPG binding site requires all 3 amino acids, and only those amino acids, in place before selectable binding occurs. Unfortunately for Behe and Snoke, the DPG binding site is a good example of plasticity and redundancy which highlights a key flaw in their “one true sequence” assumption. Li (1997), the very article they quote, gives examples of alternate sequences that work well, thus invalidating the assumption that only their “one true sequence” will have that function.
The modern mammalian DPG binding site is formed from 3 amino acids on the beta chain. Histidines (H in the single amino acid code) at position 2 and 143, and lysine (K in the single amino acid code) at position 82. All these amino acids are basic; we can call these amino acids responsible for DPG binding the HKH triad. Behe and Snoke imply that you must have the HKH triad in place for both binding and selection to take place.
Now, while all of these sites are required for good binding, there are mammals without these 3 that do quite nicely. You can replace basic histidine with basic arginine (R) and a functional DPG binding site is obtained at either position 2 or 143 (Bonaventura et al. 1975). So you can have RKH and HKR and still get DPG binding with selectable function. There are even more variants with selectable function. Mice have an asparagine (N) at position 2, giving an NKH triad. Lemurs make do with leucine (LKH). Ruminants have methionine (M) at position 2. The MKH variant is much less sensitive to DPG, but still has binding and selectable function (Angeletti et al. 2001). Even with a limited number of vertebrates, we can show that the actual example cited by Behe and Snoke, the DPG binding site, does not in fact follow their “one true sequence” model.
But it gets more interesting than that.
As one example, Li (1997) has argued that the precursor to modern hemoglobins that can bind diphosphoglycerate did not have any of the three amino acid residues involved in the interaction.
Behe & Snoke 2004 p11
This is true, but highly misleading. DPG binding is at the end of a sequence of development of allosteric modulation by anions and organic phosphates paralleling the development of tetrameric hemoglobin.
While most vertebrate hemoglobins are α2β2 tetramers, most species of hagfish, a primitive jawless fish, have monomeric hemoglobin. In other species of hagfish, the oxygenated form of hemoglobin is a monomer, and the deoxygenated form is a dimer. In all known species of lamprey, another primitive jawless fish, the oxygenated form of hemoglobin is a monomer, and the deoxygenated form is either a dimer or tetramer. In sharks, the oxygenated form is the αβ dimer, and the deoxygenated form is a tetramer. In bony fish, frogs, lizards and mammals hemoglobin is the familiar α2β2 tetramer.
In most vertebrates, organic phosphates modulate the oxygen affinity of hemoglobin, but most vertebrates use ATP, the energy bearing phosphate produced by oxidative metabolism, to modulate hemoglobin oxygen affinity (Nikinmaa 2001, Coates 1975a). Mammalian DPG binding evolved not from scratch, as implied by Behe and Snoke, but from an ATP binding site.
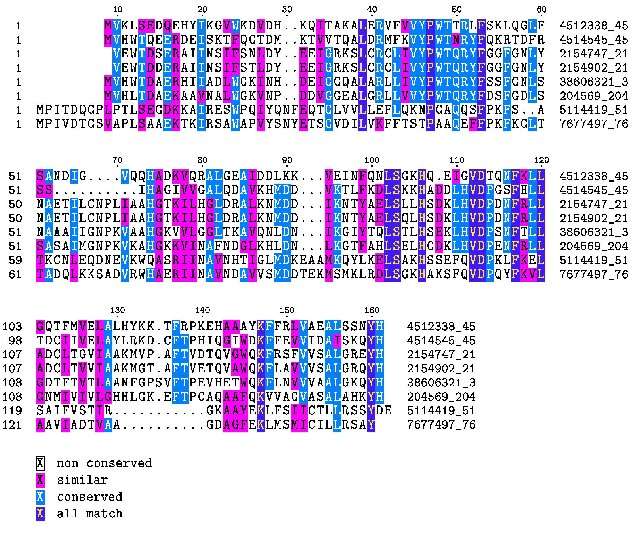
Lamprey hemoglobin is not modulated by organic phosphates, it has PSS (proline, serine) at the equivalent position of the mammalian HKH triad (see figure 1). Most hagfish hemoglobins are not modulated by organic phosphates (Brittain & Wells 1986). However, some hagfish hemoglobins that form dimers in the deoxyform are modulated (weakly) by ATP (Nikinmaa 2001). Hagfish have TKS (threonine) in the equivalent position of the mammalian HKH triad.
Sharks have dimers which associate to tetramers; these are also modulated by ATP. The key to ATP modulation appears to be the presence of lysine at position 82 on the beta chain. Although some sharks use a KES motif, lysine 82 seems to be the minimal configuration. Frog hemoglobin binds both ATP and DPG (Coates 1975b). Frogs have lysine at position 82, lysine at position 143, and either nothing or glutamic acid (E) at position 2, thus you can bind DPG (and get selectable modulation of oxygen binding) without the HKH triad, a -KK will do (which builds on an XKX which binds ATP, X being any amino acid) and thus onward and upward.
| Triad | Vertebrate | Function |
| PSS | Lamprey | no organic phosphate modulation |
| TKS | Hagfish | some ATP modulation |
| HKK/KES | Sharks | ATP modulation |
| HKR/HKK/EKK | Fish | ATP modulation |
| -KK/EKK | Frogs | ATP/DPG modulation |
| HKR | Lizards | ATP/DPG modulation. DPG not physiological in lizards |
| HKH/NKH/RKH/HKR | Mammals | DPG/ATP modulation |
The TKS phosphate binding triad in hagfish probably is neutral, as their red blood cells have little ATP or DPG (Coates 1975a). However, in sharks, which do have significant levels of ATP (Coates 1975a), this would be selectable, and requires few selectable steps to get to HKS. XKK and XKR also detectably bind DPG (and modulate oxygen affinity), so we have precursors to the mammalian DPG binding site which are functional and selectable. Thus a DPG binding site can evolve from an ATP binding site using selectively advantageous mutations almost all the way.
So, using the DPG binding site wasn’t a good example of a site requiring 3 neutral mutations to produce a fixed sequence before selectable function occurs. Some functions may require a “one true sequence” in the Behe-and-Snoke sense, but they are likely to be vanishingly rare, as even Behe and Snoke’s flagship example can be derived from simpler, selectable sequences.
Subfunctionalization vs. Neofunctionalization
Behe and Snoke’s model assumes a simplified “neofunctionalization” model of novel gene evolution. The scenario works as follows: A gene duplicates, resulting in two copies of the same gene. Because one copy continues to provide the ancestral function, the other copy is redundant, and thus has relaxed selective pressure. The redundant copy is then free to accumulate mutations, either those that give the gene a new activity, or those that inactivate the gene and render it completely nonfunctional, which then results in a pseudogene. However, as the authors explain, this simplified scenario may be the exception to the rule (Behe & Snoke 2004, p. 8). Most gene duplicates probably experience a “subfunctionalization” or similar scenario, in which both gene copies are maintained by selection for different ancestral activities. Since selection is operating more or less continuously in these scenarios, null mutations should be weeded out, increasing the likelihood for a novel feature to evolve.
Behe and Snoke are not the first to conclude that the “classic” neofunctionalization model is probably insufficient to explain the observed rate of duplicate gene preservation. Lynch and Force (2000) write,
Under the classical model of gene duplication, nonfunctionalization of one member of the pair by degenerative mutation has generally been viewed as inevitable unless the fixation of a silencing mutation is preceded by a mutation to a novel beneficial function. However, there now appear to be several plausible mechanisms for the preservation of duplicate genes. . . .
There is, however, nothing inherent in the [subfunctionalization] model that denies the significance of gene duplication in the origin of evolutionary novelty. Indeed, the subfunctionalization process may facilitate such evolution by preserving gene duplicates and maintaining their exposure to natural selection and/or by removing pleiotropic constraints.
Unfortunately, Behe and Snoke’s model cannot be applied to situations other than a simplistic neofunctionalization scenario, in which a gene duplicate has completely relaxed selection up to the point where the MR feature evolves.
There are many more questionable assumptions in Behe and Snoke’s model. (Yes, assumptions have to be made to simplify nature into tractable models, but one has to be careful not to over-simplify.) These include ignoring back mutation from null sites, resetting a gene when it acquires a null mutation, ignoring recombination and gene conversion, and ignoring confidence intervals on waiting times, which are notoriously large. However, we do not have the space to consider them all.
Rho-Oh!
There is another assumption that goes into the model that directly affects the results. This one has to do with Behe and Snoke’s estimation of the frequency of null mutations. The parameter they factor into their model is ρ, which is defined as the ratio of null mutations to “compatible” mutations that contribute to the new function. They give an example:
. . . consider a gene of a thousand nucleotides. If a total of 2400 point mutations of those positions would yield a null allele, whereas three positions must be changed to build a new MR feature such as a disulfide bond, then ρ would be 2400/3, or 800. (Any possible mutations which are neutral are ignored.)
Behe & Snoke 2004 p3
We had a hard time understanding how they got 2400 null mutations from a gene of 1000 nucleotides long. A gene of that size has 3000 possible point mutations, since each nucleotide can change into one of the remaining three. But thanks to the degeneracy of the genetic code, about 1/3 of these will be “silent” because they won’t affect the amino acid sequence of the protein. Since Behe and Snoke are ignoring neutral mutations, that should leave a maximum of about 2000 non-neutral mutations. How are they coming up with 2400?
It seemed like such a simple miscalculation that we figured the problem had to be with us. So one of us emailed Michael Behe and asked about how the 2400 number was reached. He graciously replied the next day and said that the example was only intended for illustrative purposes, which is certainly fair. He also said that mutations in non-coding portions of the gene, which control regulation, could also render it nonfunctional, which tends to push the number upward. As shown with the DPG binding site example below, it doesn’t push it up that much. However, we don’t see this as being valid no matter how one looks at it. Non-coding DNA wasn’t taken into account anywhere in their model, and a new gene duplicate doesn’t necessarily need regulation anyway. Either it can be regulated by a neighbor’s regulatory region (for example, its parent gene), or, if its regulatory regions are nullified, it can be turned “on” constantly. But the real kicker is that the number was based on assuming that around half of amino acid changes would result in a nonfunctional protein. Okay . . . but the example uses nucleotides, and more importantly, the simulations they do factor in nucleotide changes and not amino acid changes. For example . . .
consider a case where three nucleotide changes must be made to generate a novel feature such as a disulfide bond. In that instance, Figure 6 shows that a population size of approximately 1011 organisms on average would be required to give rise to the feature over the course of 108 generations. . . .
Behe & Snoke 2004 p10
And later . . .
The population size required to produce [a multi-residue] feature consisting of three interacting residues by point mutation in a duplicated gene initially lacking those residues would depend on the number of nucleotides that had to be changed–a minimum of three and a maximum of nine. If six mutations were required then, as indicated by Figure 6, on average a population size of ~1022 organisms would be necessary to fix the MR feature in 108 generations. . . .
Behe & Snoke 2004 p10
It’s clear they’re using nucleotides substitutions in their model. This is critical because, if they used amino acid changes instead, the number of changes required to produce the multi-residue feature (what they call λ) would be about half as many, and this would revise their numbers strongly downward. On the other hand, if we use nucleotides to calculate ρ, then that figure should be a great deal less, which also revises their numbers downward. (Our opinion is that nucleotides should be used consistently, as we have done in working out the DPG example.) It’s much less likely that a nucleotide substitution will be detrimental than an amino acid substitution. Aside from silent mutations, the genetic code favors conservative substitutions, and disruptive amino acids (like tryptophan) tend to be coded for infrequently. Using nucleotides rather than amino acids automatically factors this in. However, we will point out that Behe and Snoke do not even base their model on nucleotides. Instead, they use a biologically unrealistic binary model. This leads to further problems determining biologically relevant parameter values.
The simulations run by Behe and Snoke set ρ to 1000. They get this value from Walsh (1995) which uses this value as the conservative end of a range of estimates. However, Walsh doesn’t explain why he chose that range of values, and in the context of his analysis, it didn’t matter. Walsh’s analysis concerns the ratio of ρ to s (the selection coefficient) and shows under what conditions a new function is likely to be fixed for a duplicate gene. He doesn’t try to apply it to real-life examples, and changing values of ρ don’t affect the key findings of his analysis. Behe and Snoke, on the other hand, are trying to base their estimate on real-world mutational tolerance:
A gene coding for a duplicate, redundant protein would contain many nucleotides. The majority of nonneutral point mutations to the gene will yield a null allele (again, by which we mean a gene coding for a nonfunctional protein) because most mutations that alter the amino acid sequence of a protein effectively eliminate function (Reidhaar-Olson and Sauer 1988, 1990; Bowie and Sauer 1989; Lim and Sauer 1989; Bowie et al. 1990; Reidhaar-Olson and Sauer 1990; Rennell et al. 1991; Axe et al. 1996; Huang et al. 1996; Sauer et al. 1996; Suckow et al. 1996).
Behe & Snoke 2004 pp2-3, emphasis added
And later they quantify what they mean by “most”:
An estimate of ρ can be inferred from studies of the tolerance of proteins to amino acid substitution. Although there is variation among different positions in a protein sequence, with surface residues in general being more tolerant of substitution than buried residues, it can be calculated that on average a given position will tolerate about six different amino acid residues and still maintain function (Reidhaar-Olson and Sauer 1988, 1990; Bowie and Sauer 1989; Lim and Sauer 1989; Bowie et al. 1990; Rennell et al.1991; Axe et al. 1996; Huang et al. 1996; Sauer et al. 1996; Suckow et al. 1996). Conversely, mutations to an average of 14 residues per site will produce a null allele, that is, one coding for a nonfunctional protein. Thus, in the coding sequence for an average-sized protein domain of 200 amino acid residues, there are, on average, 2800 possible substitutions that lead to a nonfunctional protein as a result of direct effects on protein structure or function. If several mutations are required to produce a new MR feature in a protein, then ρ is roughly of the order of 1000.
Behe & Snoke 2004 p10
Here we can see that Behe and Snoke assume that about 70% of amino acid substitutions will result in a nonfunctioning protein. But this is almost certainly a vast overestimate. The best estimate for a protein’s tolerance to random amino acid change comes from a recent paper from Guo and coworkers (2004), in which they calculate, through direct empirical investigation, that 34 +/- 6% of random amino acid changes will eliminate a protein’s function (what they call the protein’s “x factor”). They find this to be in accord with similar studies using a broad array of proteins. In fairness to Behe and Snoke, they couldn’t have known about Guo et al. (2004) since it was published right about the time that their own paper was accepted. But the papers that they cite don’t support the 70% figure either. Each of those studies either applies mutagenesis only to a conserved region (typically the hydrophobic core or an active site), or they mutate more than one amino acid at a time, or both.
Consider Axe et al. (1996), which Behe and Snoke cite in support of their 70% estimate. In this study, the researchers applied random mutagenesis to the hydrophobic core of the enzyme barnase. They didn’t just mutate one amino acid at a time, they mutated the whole lot. Not only is the hydrophobic core expected to be much less tolerant to mutation than the protein as a whole, it’s also expected that multiple amino acid changes should be less easily tolerated than single mutations. Yet despite all that, 23% of their variants were functional, far greater than expected. This means that 77% were nonfunctional, which would accord well with Behe and Snoke’s estimate, if only this were what they were estimating. But what Behe and Snoke are actually estimating is the likelihood that a single amino acid change at a random location throughout the entire protein renders it nonfunctional. Axe et al. (1998) later did such an experiment and found that a big bad 5% of random mutations rendered barnase nonfunctional, far less than Guo’s estimate of 34%. Behe and Snoke later cite Axe et al (1998) and note that their estimate of ρ may be too high. We wonder why they cite Axe (1996) in support of their 70% assumption, when the paper is both irrelevant and contradicted by a more recent study using the same enzyme.
Being off by this much wouldn’t be such a big deal if not for the fact that ρ factors prominently into Behe and Snoke’s calculations. Small changes in the value of ρ make a large difference to the model, as the authors explain on page 11. Behe and Snoke used a value of ρ set at 1000 for their examples, which they explain in the quoted section above. But now let’s take their example and figure out what a more realistic value of ρ should be. A 200 amino acid protein will have a coding region of 600 nucleotides, which has 1800 possible point mutations. Guo et al. (2004) calculate a value for the nucleotide “x factor”, based upon the protein “x factor,” but taking into account silent mutations. The number they get is 26%. We can therefore assume that 26% of our 1800 mutations will be eliminate function, which gives us 486. So ρ should be 486 divided by the number of mutations necessary to produce the MR feature. No matter what, it will be substantially less than the 1000 figure that Behe and Snoke use. In the example with disulfide bonds, where the MR feature is assumed to require 3 nucleotide changes, ρ would be 162. According to Behe and Snoke’s own equations, this replacement could occur in 3.6x1007 generations in a population size of 108. In the example with DPG binding, where they assume 6 required changes, ρ would be 81. This replacement would occur in 3.28x10¹² generations for a population size of 108. This is orders of magnitude less than the 1.09x10¹⁹ generations that Behe and Snoke’s values would produce. As we show for the DPG binding site below, using realistic values of ρ and λ will produce reasonable times to production of binding sites.
How unlikely is the evolution of MR features?
Despite using assumptions that render their model overly pessimistic, the population size and generation time that Behe and Snoke calculate is not prohibitive for the types of organisms (haploid, asexual) that it is most applicable to. The authors conclude that population sizes of 109 would require at least 108 generations to evolve a two-site MR feature (λ=2) under their model.
And while this does seem prohibitive for large, multicellular eukaryotes, it’s actually easily achievable for bacteria. A population size of 109 is what one would find in a very small culture growing in a lab; even small handfuls of dirt, or the average human gut, will contain populations in excess of this number. Bacteria reproduce quickly; under optimal conditions for E. coli, 108 generations will occur in less than 40,000 years, a geological blink of the eye. Given that there are about 5x1030 bacteria on Earth (Whitman et al. 1998), we should expect the evolution of novel MR features to be an extremely common event – an average of many times per microsecond – even if we accept Behe and Snoke’s unrealistic assumptions.
Since we can be confident that their numbers are a vast overestimate, Behe and Snoke have ironically demonstrated that the evolution of novel gene functions is not unlikely at all. And yet, it has been a long standing claim of the ID movement that the evolution of “novelty” simply cannot happen, period. Behe and Snoke have done us the favor of disproving this bogus notion once and for all.
Applying Behe & Snoke’s equations to the DPG binding site example
Let’s take this further and apply Behe and Snoke’s own equations to the DPG binding site example. First we need to calculate λ, the number of neutral nucleotide substitutions (above we were looking at amino acid substitutions) to produce a DPG binding site.
To calculate λ we’ve used two scenarios, drift from the hagfish or lamprey sequence to a known DPG binding site, or to a bony fish or a shark ATP binding site.
Now, first let’s chart some single nucleotide steps from the hagfish or lamprey sequence to HKS, a known DPG binding sequence with weak but functional (and hence selectable) DPG binding. Then let’s look at the steps from that to the ATP binding site of a bony fish (Tuna HKR) and Port Jackson Shark (HKK). Again the letters are the one letter amino acid code, the number in parentheses is the number of nucleotides that needs to be changed to get from one amino acid state to the other. These are not the only paths (or possible endpoints), but they show that there are multiple possible ways to get to even a narrowly defined target. The number of nucleotide steps differs from the number of amino acid substitutions above, because in some cases you can’t go directly from the code for one amino acid to the other.
| Hagfish to DPG binding | Lamprey to DPG binding | DPG to Shark | ||
| T K S | P S S | H K S | ||
| N K S (1) | K K S (1) | R K S (1) | H S S (1) | H K R (1) |
| H K S (1) | N K S (1) | R K S (1) | H R S (1) | H K K (1) |
| H K S (1) | H K S (1) | H K S (1) |
Note (a) that the maximum path length from no/very weak DPG binding to selectable binding is between 2-3 substitutions, rather than the 6 nucleotide substitutions that Behe and Snoke imply. Note also that the “neutral” substitutions N, K and R, especially basic K and R, are amino acids that are found in ATP/DGP binding hemoglobins in those positions (see above). Indeed HKR is the ATP binding motif in bony fish. So the “neutral drift” from either hagfish or lamprey to a selectable inorganic phosphate binding site is between 2 to 4 nucleotides depending on your endpoint. Thus λ is between 2 and 4.
Next we need ρ, which is defined as the number of null mutations divided by λ. To find the number of null mutations, we multiply the size of the gene in nucleotides by 3 (to get the number of alternative nucleotides) multiply that by the fraction of nucleotide replacements that are null (i.e. generate functionless peptides). For these calculations we shall use the length of the lamprey gene which is 452 nucleotides.–This makes things harder for ourselves as the lamprey and hagfish genes are substantially longer than the shark or bony fish genes.–Contrast Behe and Snoke’s null factor (0.7), derived from amino acids, with a more realistic one (0.3), derived from nucleotides, which is conservative compared with the null factor of 0.26 calculated by Guo (2004). Now we are in a position to calculate time to fixation (Tfx).
We’ve used a program kindly provided by E. Tellgren to calculate Tfx, using Behe and Snoke’s equation 4. Now using Behe and Snoke’s figures of 1x10⁻⁸ for the mutation rate, 0.7 for null factor, and realistic values of ρ and λ into ET’s program gives the following generations to fixation for various population sizes (N) from 106to 109.
| N | λ (ρ) | ||||
| 2 (316.4) | 3 (210.933) | 4 (158.2) | 5 (126.56) | 6 (105.467) | |
| 1006 | 3.55x1007 | 1.48x1009 | 1.71x10¹¹ | 1.76x10¹³ | 1.57x10¹⁵ |
| 1007 | 1.04x1007 | 1.93x1008 | 1.72x10¹⁰ | 1.76x10¹² | 1.57x10¹⁴ |
| 1008 | 3.21x1006 | 5.04x1007 | 1.76x1009 | 1.76x10¹¹ | 1.57x10¹³ |
| 1009 | 1.01x1006 | 1.93x1007 | 2.17x1008 | 1.76x10¹⁰ | 1.57x10¹² |
Table: Effect of realistic population sizes (N), ρ and λ (number of neutral replacements required to form the site) on time to fixation (Tfx) of a DPG binding site in generations. Tfx calculated from Behe and Snoke’s equation 4.
Now, Behe and Snoke claim in their paper that, for an MR site with six sites (λ = 6) and a ρ of 1000, a population would require 1x10²² generations to fix such a site in a population, a mind-boggling large amount of time and far longer than the age of the universe if one generation is one year. They imply that these figures are applicable to the DPG binding site. However, as we can see, using a protein size that overestimates the size of the evolving hemoglobin protein and Behe and Snoke’s overly conservative figures for null mutation rate (0.7), a DPG binding site could evolve quite rapidly.
We’re pretty sure that there are more than 10 million hagfish or lampreys around. As you can see from the table, with a mere 10 million hagfish, Behe and Snoke’s own equation finds that on average a population would get to the functional bony fish ATP binding site in 190 million years, assuming one generation a year. This is not unrealistic considering that agnathans and elasmobranchs are separated by approximately 100 million years in the fossil record as it stands. If we use Behe and Snoke’s own 100 million individuals for the population cut off, the hagfish to bony fish sequence could be acquired on average in a mere 50 million years. The lamprey to bony fish site would require on average around 2 billion years using Behe and Snoke’s 100 million individuals cut off, rather long, but orders of magnitude below the 1x10²² Behe and Snoke imply.
Now let’s look at what happens when we use the more realistic null mutation rate of 0.3. With a population of 10 million (again, realistic for vertebrates), you can get from the hagfish to the bony fish site in 50 million years, and from the lamprey to the bony fish site in 600 million years. Using Behe and Snoke’s population of 100 million, you can get on average from the hagfish to the bony fish site in 10 million years and from the lamprey to the bony fish site in about 100 million years. Again, remember we are biasing ourselves by using larger proteins, and assuming that intermediates are neutral even though we know they are selectable.
In the above calculations we’ve been using the length of the protein coding gene. That is, from translation start codon to translation stop codons, but actual genes are larger than the translation frame. So here we have looked at the effect of using the whole gene, not just the translated bits, on the time to fixation (Tfx). Aside from the transcription initiation site, the rest of the gene outside the translation frame is probably neutral, so this overestimates time to fixation as well. We couldn’t find the shark transcription sequence, so we’ve used the Lamprey sequence for comparison. Using Behe and Snoke’s population of 100 million organisms you can get the hagfish to bony fish site on average in 50 million years, and the lamprey to bony fish site on average in 600 million years.
So, plugging Behe and Snoke’s own example in to Behe and Snoke’s own equation gives values that are compatible with the fossil record, even assuming intermediates with known or probable function were functionless, using overestimates of protein size and using an overestimate of null mutation rate. More realistic values of the null mutation rate suggest that even systems with large λ’s can evolve in reasonable times.
Conclusion
We began this essay with a quotation from Behe complaining that a paper describing an evolutionary simulation (Lenski et al. 2003) had “precious little real biology” in it. What we see here is that Behe and Snoke’s paper is acutely vulnerable to the same criticism. A theoretical model is useful to the extent that it accurately represents or appropriately idealizes the processes that occur in the phenomenon being studied. Although it is worthwhile to investigate the importance of neutral drift, Behe and Snoke have in our opinion over-simplified the process, resulting in questionable conclusions.
Their assumptions bias their results towards more pessimistic numbers. The worst assumption is that only one target sequence can be hit to produce a new function. This is probably false under all circumstances. The notion that a newly arisen duplicate will remain selectively neutral until the modern function is firmly in place is also probably false as a general rule. Their assumption that 70% of all amino acid substitutions will destroy a protein’s function is much too high. And finally, we have shown that their flagship example does not require a large multi-residue change before being selectable.
And ironically, despite these faulty assumptions, Behe and Snoke show that the probability of small multi-residue features evolving is extremely high, given the types of organisms that Behe and Snoke’s model applies to. When we use more realistic assumptions, though many bad ones still remain, we find that the evolution of multi-residue features is quite likely, even when there are smaller populations and larger changes involved. In fact, the times required are within the estimated divergence times gleaned from the fossil record. We can therefore say, with confidence, that the evolution of novel genes via multi-residue changes is not problematic for evolutionary theory as currently understood.
Acknowledgements
The authors would like to thank the many people who offered suggestions on this essay, our fellow contributors to The Panda’s Thumb, and especially E. Tellgren who provided an application to evaluate Behe and Snoke’s equations.
- Angeletti M et al. (2001) Different functional modulation by heterotropic ligands (2,3-diphosphoglycerate and chlorides) of the two haemoglobins from fallow-deer (Dama dama). Eur J Biochem 268: 603-611.
- Axe DD et al. (1996) Active barnase variants with completely random hydrophobic cores. PNAS 93: 5590-5594.
- Axe DD et al. (1998) A search for single substitutions that eliminate enzymatic function in a bacterial ribonuclease. Biochemistry 37(20): 7157-66.
- Behe MJ (1996) Darwin’s Black Box. The Free Press, New York.
- Behe MJ (2000) In Defense of the Irreducibility of the Blood Clotting Cascade: Response to Russell Doolittle, Ken Miller and Keith Robison. Access Research Network. (Accessed 9/25/04).
- Behe MJ & Snoke DW (2004) Simulating evolution by gene duplication of protein features that require multiple amino acid residues. Protein Science, Epub ahead of print (Accessed 8/31/04).
- Bonaventura J et al. (1975) Hemoglobin Deer Lodge (beta 2 His replaced by Arg). Consequences of altering the 2,3-diphosphoglycerate binding site. J Biol Chem., 250: 9250-5.
- Brittain T & Wells RM (1986) Characterization of the changes in the state of aggregation induced by ligand binding in the hemoglobin system of a primitive vertebrate, the hagfish Eptatretus cirrhatus. Comp Biochem Physiol A 85(4): 785-90.
- Caenepeel S et al. (2004) The mouse kinome: discovery and comparative genomics of all mouse protein kinases. PNAS 101(32):11707-12.
- Coates ML (1975a) Hemoglobin function in the vertebrates: an evolutionary model. J Mol Evol 6(4): 285-307.
- Coates ML (1975b) Studies on the interaction of organic phosphates with haemoglobin in an amphibian (Bufo marinus), a reptile (Trachydosaurus rugosus) and man. Aust J Biol Sci 28(4): 367-78.
- Copley SD (2000) Evolution of a metabolic pathway for degradation of a toxic xenobiotic: the patchwork approach. Trends Biochem Sci. 25(6): 261-5.
- Cunchillos C & Lecointre G (2003) Evolution of amino acid metabolism inferred through cladistic analysis. J Biol Chem. 278(48):47960-70.
- Dembski W (2004) Presentation at DDDV. Communicated by MK Johnson.
- Discovery Institute (2004) Media Backgrounder: Intelligent Design Article Sparks Controversy. (Accessed 10/7/04)
- Gerlt JA & Babbitt PC (2001) Divergent evolution of enzymatic function: mechanistically diverse superfamilies and functionally distinct suprafamilies. Annu Rev Biochem 70:209-46.
- Guo HH et al. (2004) Protein tolerance to random amino acid change. PNAS 101(25):9205-10.
- Hall BG (2003) The EBG system of E. coli: origin and evolution of a novel beta-galactosidase for the metabolism of lactose. Genetica 118(2-3) :143-56.
- Huang W et al. (1996) Amino acid sequence determinants of beta-lactamase structure and activity. J Mol Biol. 258: 688-703.
- Johnson GR et al. (2002) Origins of the 2,4-dinitrotoluene pathway. J Bacteriol 184(15): 4219-4232.
- Kiernan V (2003) Simulation Demonstrates Evolutionary Process. The Chronicle of Higher Education June 6.
- Lenski RF et al. (2003) The Evolutionary Origin of Complex Features. Nature 423(6936): 139-44.
- Li WH (1997) Molecular Evolution. Sinauer Associates, Sunderland, MA.
- Lynch M & Force A (2000) The probability of duplicate gene preservation by subfunctionalization. Genetics 154(1):459-73.
- Manning G et al. (2002) The protein kinase complement of the human genome. Science 298(5600):1912-34.
- Melendez-Hevia E et al. (1996) The puzzle of the Krebs citric acid cycle: assembling the pieces of chemically feasible reactions, and opportunism in the design of metabolic pathways during evolution. J Mol Evol. 43(3):293-303.
- Meyer S (2004) The Origin of Biological Information and the Higher Taxonomic Categories. Proc Bio. Soc. Wash. 117(2):213-239.
- Miller (1999) The Evolution of Vertebrate Blood Clotting (Accessed 10/01/04).
- Musgrave I (2003) Spetner and Biological Information (Accessed 10/01/04).
- Musgrave I (2004) ID research, is that all there is? (Accessed 10/01/04).
- Nikinmaa M (2001) Haemoglobin function in vertebrates: evolutionary changes in cellular regulation in hypoxia. Resp Physiol 128: 317-329.
- Ohta T (1987) Simulating evolution by gene duplication. Genetics 115: 207-214.
- Sauer RT et al. (1996) Sequence determinants of folding and stability for the P22 Arc repressor dimer. Faseb J. 10: 42-48.
- Schmidt et al. (2003) Evolutionary potential of (beta/alpha)8-barrels: functional promiscuity produced by single substitutions in the enolase superfamily. Biochemistry 42(28):8387-93.
- Seffernick JL & Wackett LP (2001) Rapid evolution of bacterial catabolic enzymes: a case study with atrazine chlorohydrolase. Biochemistry. 40(43): 12747-53.
- Walsh JB (1995) How often do duplicated genes evolve new functions? Genetics 139(1):421-8.
- Waterston RH et al. (2002) Initial sequencing and comparative analysis of the mouse genome. Nature 420(6915):520-62.
- Whitman et al. (1998) Prokaryotes: the unseen majority. PNAS 95(12):6578-83.