
Fun with Hominin Cranial Capacity Datasets (and Excel)
 For some time I have been annoyed that charts of the changing cranial capacity of fossil hominin skulls are not more common. There is this chart online at the Talk.Origins Fossil Hominids FAQ, derived from this 1994 PNAS paper, but that is about it. I wanted to make my own chart, but there was no easy way to get all of the relevant data. Then, this week, I ran into this amazing paper (De Miguel and M. Henneberg 2001*), which conviently included a 29-page Appendix listing every known published measurement of a hominin skull older than 10,000 years old.
While killing my brain cells by listening to the radio broadcast of the ID movement presenting cutting-edge research in the USF Sun Dome conducting an old-fashioned creationist revival in the USF Sun Dome,** I schlepped all 602 measurements and metadata into Excel.
I am not complaining here, but I would like everyone to know that this was exceedingly tedious – many specimens have more than one measurement and there are all sorts of notes about various taxon designations, juvenile specimens, specimens confused with other specimens, and the like. I can’t imagine how long it took the authors to assemble the table and the 239 references they cited. But it did dull the pain from the Sun Dome broadcast.
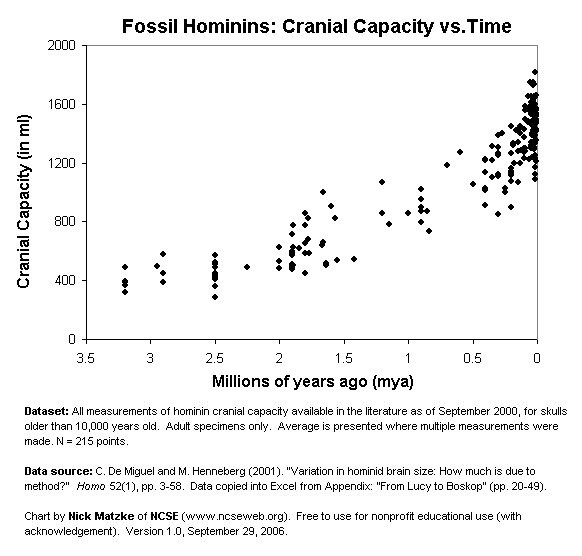
And, once the numbers were in Excel, I was able to recalculate the averages for each specimen, exclude the juveniles and dubious specimens that the authors excluded, and more-or-less reproduce the charts they have in their paper. The big advantages are (a) my chart can be freely reproduced and (b) I can play with it in future blog posts. For now, here is just your basic plain-vanilla chart of cranial capacity vs. time:
It seems to me that every popular-level discussion of human evolution should use this sort of chart as much as possible. Creationists should be embarrassed and ashamed about the huge mass of evidence they ignore every time they fail to mention the stunning, overwhelming, transitional, gradual, nature of the hundreds of ancient fossil skulls that have been discovered since Darwin and Huxley postulated apelike ancestors for humans back in the 1800s. The evidence is simply an astonishing confirmation of evolution, and the endless pages of creationist diatribes about the lack of transitional hominid fossils are revealed to be mere verbal obfuscation when compared to this simple chart. I suspect that in the entire history of creationist/ID writings, not one of them has been brave enough to show a chart like this to their readers, and then continue to maintain that there are no transitional fossils between humans and their apelike ancestors. Icons of Evolution doesn’t do it. Of Pandas and People doesn’t do it. But I would be happy to be proven wrong.
De Miguel and Henneberg are the same people who authored the 2004 paper “Hominins are a single lineage: brain and body size variability does not reflect postulated taxonomic diversity of hominins.” Here is the abstract:
Henneberg and de Miguel (2004). “Hominins are a single lineage: brain and body size variability does not reflect postulated taxonomic diversity of hominins.” Homo. 55(1-2), pp. 21-37.
Fossil hominin taxonomy is still debated, chiefly due to the fragmentary nature of fossils and the use of qualitative (subjective) morphological traits. A quantitative analysis of a complete database of hominin cranial capacities (CC, n = 207) and body weight estimates (Wt, n = 285), covering a period from 5.1 ma (millions of years) to 10 ka (thousands of years) shows no discontinuities through time or geographic latitude. Distributions of residuals of CC and Wt around regressions on date and latitude are continuous and do not differ significantly from normal. Thus, with respect to these characteristics, all hominins appear to be a single gradually evolving lineage.
Whether or not you agree with scrapping hominin taxonomy (major plus: it would vastly reduce creationists’ ability to transmogrify pedestrian taxonomic hairsplitting into wild declarations of the absense of transitional hominin fossils), a result like this should make it hard for anyone to take seriously the idea that there are major discontinuities in the hominin fossil record. But strangely, this paper is not cited in Casey Luskin’s 2005 analysis of hominid evolution (which I discussed briefly last week). This has not stopped Luskin from keeping up his argument for the special creation of humans by citing the allegedly drastic size difference between Australopithecus and Homo, as he has done several times by putting up this graphic from Hawks et al. (2000)***:

Hmm. Is comparing two fossils the best way to assess the question of whether or not there is a huge gap in the hominin fossil record? Lucky for us, Henneberg and de Miguel (2004) put their spiffy database to use, and plot both hominin cranial capacity and body mass in Figure 1:
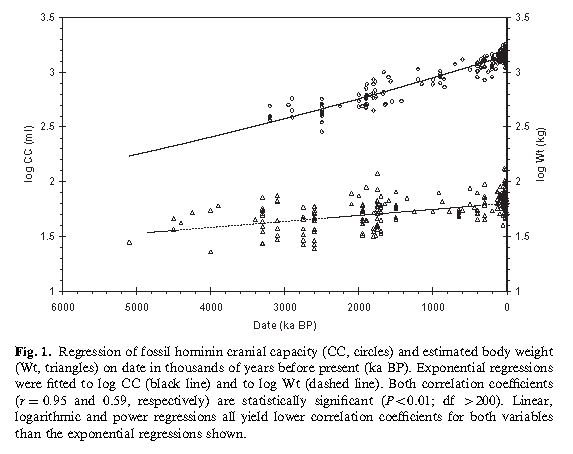
This chart is a little more complex to interpret. The top set of points is cranial capacity, corresponding to the vertical axis on the left. This is essentially the same data that I plotted above – it just plots on a straight line here because the authors are using a logarithmic scale for the y-axis.
The bottom set of points is body mass, corresponding to body weight in kilograms (right-hand axis). This is also on a log scale. There are two interesting scientific points here: (1) cranial capacity increased disproportionately compared to a slower increase in body weight during human evolution (which everyone hopefully knew already) and, (2), in fact, contra Luskin, the fossil evidence makes the increase in body mass look pretty darn gradual also.
P.S.: I would like to generate my own spiffy plots of hominin body weight estimates over time, but the dataset seems to have been published in this annoyingly rare publication:
De Miguel and Henneberg (1999). “Variation in hominid body size estimates: Do we know how big our ancestors were?” Perspectives in Human Biology, 4(1), pp. 65-80.
Here is the WorldCat entry for the series. If anyone happens to have it handy, please email me a scan at matzkeATncseweb.org if you get a chance.
Notes
* The paper is: C. De Miguel and M. Henneberg (2001). “Variation in hominid brain size: How much is due to method?” Homo 52(1), pp. 3-58.
In this paper, the authors, Carmen de Miguel and Maciej Henneberg of the Department of Anatomical Sciences, University of Adelaide, Australia, conducted a study of the experimental error in researcher measurements of cranial capacity. Although I am not discussing this in detail here, this question is interesting in itself. Basically the authors found that the error is substantial, and due to numerous sources such as different reconstructions of mushed skulls, but (creationists, take note!) despite these errors, the time variable explains 89% of the variance in the dataset. The error is significant, but is still overwhelmed by the time-dependent trend:
When the entire time span of more than 3 Ma is analysed jointly, the date (= time) is responsible for the major portion (89%) of the variation in hominid cranial capacity, while taxa on their own are responsible for a minor portion of this variation (5%), the rest being errors of estimates. (De Miguel and M. Henneberg 2001, p. 16)
The authors conclude that their study supports previous studies indicating that the change in cranial capacity can be explained by “a typical Darwinian mechanism” of exponential increase in a quantitative trait under selection. (Creationists, take note again: “exponential increase” does not mean “sudden” – think of compound interest.)
** Summary of ID Sun Dome broadcast: same ol’, same ol’, but the radio hosts narrated the event like it was a football game, which was hilarious – “Wow, Bob, Jonathan Wells sure answered a lot of tough questions just now, didn’t he?” “Yes, Shelly, isn’t this pure science great? This is really impressive stuff we’re hearing, and it’s all science, not religion!” “Oh, and isn’t it awful how the textbooks and public schools are lying to kids?” “Up next is the famous Michael Behe, but first we’re going to watch a segment from this amazing ID video, which you can get free by signing up with Physicians and Surgeons for Scientific Integrity.” “What’s that website again, Bob?”…etc. This is a paraphrase, but I Am Not Making This Up.)
*** See also this recent debunking at afarensis.