
Junk to the second power
The ID blogosphere is much agog, and has been for some time, about recent (and not so recent) results that suggest some sort of functionality in what has long considered to be nonfunctional (junk) DNA in eukaryotes. The most recent buzz centers on studies (such as ENCODE ) that indicate that large swaths of so-called junk DNA are “expressed” by RNA polymerase II. Apparently, the fact that RNA polymerase transcribes alleged junk DNA is a blow to Darwinism, and a feather in the cap of ID. Their excitement in this regard, I suspect, will wane greatly once they learn some of the true implications of these results. For the matter of “expression” in junk DNA is one wherein ID meets, and gets swallowed by, the Garbage Disposal.
What follows is a discussion of a relatively recent report that rains on the ID parade. As is my habit, I’ll summarize the essay for those with short attention spans – the bottom line is that the so-called “function” that so excites the ID proponents may be little more than manifestations of quality control in gene expression, and that the supposed functional swaths of non-coding junk DNA may be nothing more than parts of the genome that encode, and lead to the production of, “junk” RNA (if I may so bold as to coin a phrase). In a nutshell, junk piled on top of junk.
The paper I will discuss in this essay appeared in 2005, and was authored by Wyers et al. This group was interested in studying the putative substrates of a nucleus-specific RNA degrading protein (Rrp6, a subunit of the nuclear exosome; see my previous essay for a bit more on the exosome, and for other facts that pertain to this essay). The impetus for the careful and systematic studies in this paper were the results shown in Figure 1, which is reproduced here. This is a microarray comparison of genome-wide steady-state RNA abundance in yeast; basically, oligonucleotide probes that together represent all 6400 of known yeast genes, along with 600 probes defined by other criteria (occurrence in SAGE libraries, encoded by the mitochondrial genome, to name but two) were printed on small chips, and these chips were subsequently hybridized with fluorescently-labeled copies of RNA prepared from either the wild-type or otherwise isogenic rrp6 mutant strains. Because fluorescence is easily measured and quantified, it is possible to convert these results to relative abundances of mRNAs corresponding to each probe. Because the “identity” (= sequence) of each oligonucleotide probe is known by definition, the results of this study may be translated into a depiction of RNA abundance along the yeast genome.
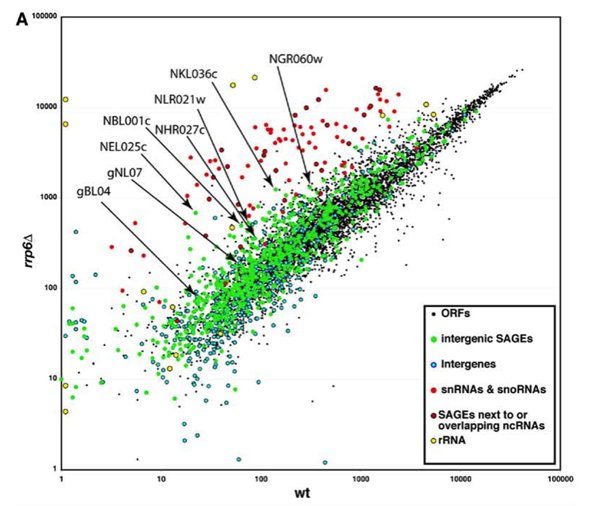
These authors were interested in identifying genes whose RNA products increased dramatically in abundance in the rrp6 mutant compared with the wild-type. And indeed, many were found. As should be expected (see my previous essay), stable RNAs (ribosomal RNAs, snRNA, snoRNAs) were prominently stabilized by the rrp6 mutation. However, among the parts of the genome that apparently encoded rrp6-dependent RNAs were a number of positions that look to have no protein product (“Intergenic” in the figure). That these regions were expressed had been suggested by the existence of so-called SAGE (see footnote 1) tags from these regions. This result – SAGE tags from intergenic regions – is roughly analogous to that which has been seen in the ENCODE study (as I discuss near the end of this essay). What the results shown in Figure 1 suggest is that some of these intergenic transcripts are targets of rrp6-mediated RNA turnover. More than 20% of these probes showed at least a 2-fold greater expression in the rrp6 mutant than the wild-type. A similar bias with the “ORFs” probes was not seen. (For those of you who are inclined, Fig. 1B of the paper deals with this issue, and indicates that a pretty high proportion of the “green dots” are expressed at higher levels in the rrp6 mutant, compared with the “ORFs” probes.)
The source of these RNAs was something that needed to be worked out, so as to better understand what is going on here. Accordingly, the authors chose some of these (indicated in Figure 1 of this essay) for further study. Using a comprehensive range of approaches, the authors showed that these RNAs were the products of transcription by RNA polymerase II. The evidence included that they could be immunoprecipitated with antibodies against the distinctive 5’-cap structure of a typical polII transcript, their synthesis was specifically affected by mutations in a polII subunit but not a polIII subunit, and they were associated in vivo with polII (shown by chromatin immunoprecipitation – see footnote 2).
Further analysis indicated that these intergenic RNAs are usually unstable in wild-type cells (readers are referred to Figure 5 for this result), being stabilized by the rrp6 mutation. In the rrp6 mutant, curiously enough, these otherwise cryptic unstable transcripts were found to be polyadenylated. However, the enzyme responsible for adding these poly(A) tails is not the canonical poly(A) polymerase that adds the poly(A) tail to mRNAs destined for the cytoplasm and translation. Rather, a different nucleotidyltransferase, Trf4 (as well as its cousin Trf5) adds these poly(A) tails. My previous essay described how these enzymes have been shown to be involved in the turnover of RNAs in eukaryotes, and how the polyadenylation harkens to the bacterial mode of RNA degradation. What is important for this essay is that the link with Trf4 argues strongly that these RNAs are destined, from the outset, for degradation. Taken as a complete package, these studies reveal a still-underappreciated phenomenon, that much of the RNA made by a cell is thrown away. This includes RNA encoded by intergenic regions.
What does this say for the larger picture? The ENCODE study, for example, used a similar array of techniques (microarrays, chromatin immunoprecipitation) to show that regions of the human genome with no apparent function are transcribed. The ENCODE studies did not include comparisons with cells deficient in rrp6, other exosome subunits, or Trf4/5-like poly(A) polymerases, so we cannot say for certain that the transcripts identified in the ENCODE project as being derived from non-coding parts of the genome (“junk DNA”) are exactly analogous to the Cryptic Unstable Transcripts identified by Wyers et al. But this is likely, given the broad conservation of the components that degrade these Cryptic Unstable Transcripts in yeast. Which means that all of this excitement about RNAs encoded by junk DNA is not warranted – unless one tends to get excited at the prospects of junk, junk squared, and garbage disposals. In a nutshell, what looks like junk may not only be junk, it may give rise to even more junk.
(There are several other interesting aspects to this story – how does a cell distinguish “productive” from “junk” RNA?, are there implications vis-à-vis gene origination and loss hidden somewhere in all of this? - that will have to wait for future discussions.)
Reference:
Wyers F, Rougemaille M, Badis G, Rousselle JC, Dufour ME, Boulay J, Régnault B, Devaux F, Namane A, Séraphin B, Libri D, Jacquier A. 2005. Cryptic pol II transcripts are degraded by a nuclear quality control pathway involving a new poly(A) polymerase. Cell 121: 725-37. doi:10.1016/j.cell.2005.04.30
Footnotes
-
SAGE = Serial Analysis of Gene Expression. This term represents a high-throughput approach to characterizing and quantifying gene expression. Briefly, the RNA population in a cell is converted to collections of concatameric sequence tags of relatively uniform size, these collections are sequenced en mass, and the occurrences of individual sequences, or of tags that correspond to known genes, are counted. Expression levels may be estimated as the fraction (tags per million, for example) of the total pool of tags that corresponds to a particular gene.
-
Chromatin immunoprecipitation is a technique whereby one may study the parts of a genome that are associated with a specific protein. In this technique, living cells are treated with formaldehyde, a chemical that promotes chemical crosslinking between nucleic acids and proteins (as well as between proteins and proteins – this is the reason formaldehyde is used as a sort of preservative), then they are broken and the specific protein of interest removed from the cell-free extract by immunoprecipitation. (Immunoprecipitation entails adding antibodies to an extract, and then recovering these with immobilized affinity reagents such as Protein A Sepharose.) After the immunoprecipitates are washed free of non-specifically bound proteins, the formaldehyde crosslinks are reversed by treatment at high temperatures, the DNA that was associated with the immune complex recovered, and PCR analysis performed to estimate the extent to which specific genome regions (which are defined by the PCR primers) are enriched in the immune complexes.