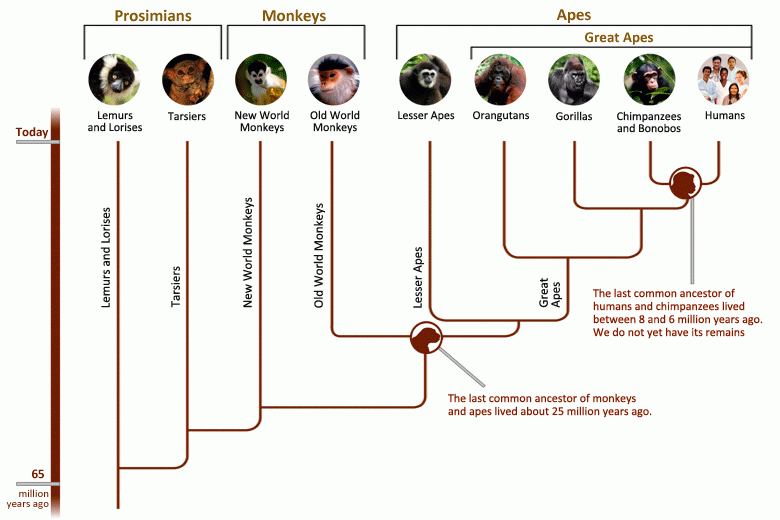
The Family Tree of Life
In the next few weeks, we’ll be posting a series of articles for the general public focused on understanding how species are related and how genomic data is used in research. We start with a background on phylogenetic trees.
Imagine you could go back in time and meet your great grandmother or even your great-great-great-great-great grandmother, when they were your age. Would they look like you? Or would they look more like your siblings or cousins? Maybe you would all look a little different. Scientists try to figure out how the distant ancestors of apes, other animals, plants, and all organisms living today looked and behaved, much in the same way that people use a family tree to trace their ancestry.

In evolutionary biology scientists use a type of tree called a “phylogenetic tree” to organize the history of how species descended from common ancestors. The closer two species are to a common ancestor on the phylogenetic tree, the more closely the two are related.
Take the phylogenetic tree of primates, for example. The common ancestor of apes lived about 18 million years ago. But over time, this one group branched off to form many different species, including humans, which have their own separate branch on this tree.
How did so many unique species develop from one ancestor? New branches formed by a process known as divergence. When groups of ancient organisms became geographically isolated from one another, either through migration or geologic events like earthquakes, each group began to develop its own unique set of physical attributes. Sometimes, by chance, a change in a characteristic enabled an individual to survive better in its environment and produce more offspring.
Perhaps individuals in one group with larger arms were better able to break open the hard-shelled fruits that were common in one region, while some individuals in another group had the ability to travel more easily through tall trees that offered protection from predators. Whatever the reason may have been, selection favored genetic differences that improved survival. Over time, this gradual process of isolation and selection produced distinct species, which in turn branched into more species.
The end result of divergence is many species, related in a tree-like fashion, and we display these relationships using phylogenetic trees. Scientists now use increasingly sophisticated methods to determine how species were related and build phylogenetic trees. In the past, scientists built these trees simply by comparing physical traits, like how many limbs an organism has or whether it has a tail. But with the recent surge in fast and affordable gene sequencing technologies, researchers today can directly compare species’ DNA to determine how they are related.
But analyzing entire genomes, with billions of DNA base pairs, presents its own unique set of challenges, and researchers often struggle to determine if the DNA differences they find between species are truly significant or are simply due to common variability. As computer software and statistical analysis become more adept at handling these challenges, our understanding of species’ relationships could change — providing exciting new insights into our family tree of life.
Check back next week when we discuss the differences between studying small and large datasets, and the challenges associated with big data analysis. This series is supported by NSF Grant #DBI-1356548 to RA Cartwright.
