
Disparity, Diversity and the Cambrian Explosion
 (Click picture to pop-up a larger version) Charles R. Marshall in EXPLAINING THE CAMBRIAN “EXPLOSION” OF ANIMALS, Annual Review of Earth and Planetary Sciences Vol. 34: 355-384, shows how the ‘classical’ view of the Cambrian as popularized by Gould cannot longer be maintained given the available data.
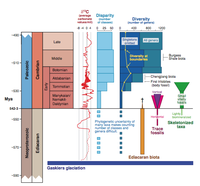
Abstract: The Cambrian “explosion” is a unique episode in Earth history, when essentially all the animal phyla first appear in the fossil record. A variety of environmental, developmental (genetic), and ecological explanations for this complex and somewhat protracted event are reviewed, with a focus on how well each explains the observed increases in disparity and diversity, the time of onset of the radiation, its duration, and its uniqueness. The increase in disparity (the origin of the phyla) and diversity are best understood as being the result of the interplay of the combinatorial bilaterian developmental system and the increase in the number of needs the first bilaterians had to meet as complex ecological interactions developed. The time of onset is constrained by the evolution of the environment, whereas its duration appears to be controlled primarily by rates of developmental innovation. The uniqueness of the event is either due to ensuing developmental limitation, to ecological saturation, or simply to the exhaustion of ecologically viable morphologies that could be produced by the nascent bilaterian developmental system.
A little background about the concepts of disparity and diversity may be in order
To assess the differences between organisms, the amount of diversity and disparity are estimated. Diversity is simply counts of taxa (sets of organisms related together by certain characteristics). In other words, it is the number of species, genera, families, and so forth in the traditional taxonomy of Linnaeus. Disparity, on the other hand, describes the extent of morphological differences between various taxa. This is essentially the organization of anatomical form that defines the larger sets of organisms.
Figure 2. Several hypotheses of the evolution of morphological diversity, or disparity. (a) Traditional model of gradually increasing disparity over time; (b) Model of maximum disparity early in evolutionary history and eventual stabilization; (c) Model of long-term gradually increasing disparity of cryptic deep Precambrian animals and followed by rapid stabilization; (d) Model of short-term gradually increasing disparity of cryptic late Precambrian animals followed by eventual stabilization. Image courtesy of M.A. Wills of the University of Bath, UK.
Despite the incompleteness of the fossil record, it is agreed upon that Cambrian diversity is lower than that of today. But it has been shown that the disparity of organisms in the Burgess Shale was nearly equal to that of modern organisms. This has been done using a variety of independent methods, including empirical and theoretical approaches. This means that in only the first 10 percent of the history of multicellular life, around 80 percent of modern disparity was reached, demonstrating the rapidity of the evolution of form.
Another useful picture is from Wonderful strife: systematics, stem groups, and the phylogenetic signal of the Cambrian radiation, Paleobiology, 31(2), 2005, pp. 94–112 by Derek E. G. Briggs and Richard A. Fortey
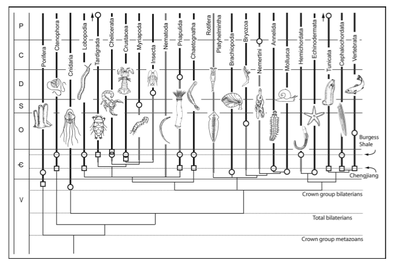
FIGURE 2. The fossil record and metazoan phylogeny. Relationships are illustrated as in Pennisi 2003. Dark lines represent the stratigraphic range of maj r metazoan taxa from their first appearance in the fossil record, indicated by a square, to the present. Light lines represent ghost ranges implied by a previous occurrence of a related taxon. The data on Lobopodia, Brachiopoda, Mollusca, Hemichordata, and Echinodermata, as well as phyla that first appear after the Cambrian, are from Benton 1993. Other first appearances are discussed in the text. Since Wonderful Life (1989), when first appearances were as indicated here by circles, discoveries in the Chengjiang fauna have pushed various Burgess Shale occurrences back 20 million years—Ctenophora, Lobopodia, Priapulida, Chaetognatha, Cephalochordata—and the vertebrates back from the Ordovician. The range of the tardigrades has extended from the Tertiary to the Cambrian, and the tunicates have acquired a reliable Cambrian record. Sponges have been discovered in the Vendian.
And then we have the interpretation of the Cambrian by ID creationist Casey Luskin
Figure 2. a) Representation of the tree of life and the fossil record, as predicted by Darwin. Fossils should show smooth transformations from one morphological form to another. b) An idealized schematic of the fossil record as predicted by punctuated equilibrium. Transitional forms are missing, as is predicted by “punctuated equilibrium”, however breaks between morphology and various fossil species are not exceedingly large. c) A schematic representing the actual fossil record as it pertains to the major animal phyla. Morphologically diverse organisms appear all at once along the Cambrian / Pre-Cambrian boundary, without any fossil ancestors. Dubbed the “Cambrian Explosion,” this “explosion” phenomenon is also recognized for the origin of fish, birds, mammals, and plants. Despite this evidence and the lack of fossils confirming Darwin’s original theory of descent with modification (a), according to its proponents, Darwin’s theory is not falsified.
And since we are visiting with our creationist friends, let’s address the following misunderstanding
Casey Luskin wrote:
As Doolittle indicates, from the base of the tree of life, it is not “tree-like.” In the “bush” below (Figure 3), it is impossible to reconstruct such trees, as the observed distribution of characters create something which looks more like a tangled thicket or a bush. The three major “domains” of life–Bacteria, Archaea, and Eukarya have a distribution of characteristics which does not allow a tree to be constructed to describe their alleged ancestral relationships. This is due to a character distribution which is not what one would predict if they inherited their genes through common ancestry:
and yet, science, contrary to ID creationist claims, has successfully recreated trees, with the addition of horizontal gene transfer
Once again our friends at TalkOrigins help us out:
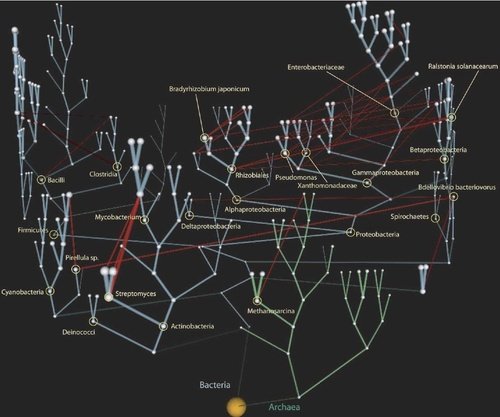
The figure is from The net of life: Reconstructing the microbial phylogenetic network by Victor Kunin, Leon Goldovsky, Nikos Darzentas and Christos A. Ouzounis
It has previously been suggested that the phylogeny of microbial species might be better described as a network containing vertical and horizontal gene transfer (HGT) events. Yet, all phylogenetic reconstructions so far have presented microbial trees rather than networks. Here, we present a first attempt to reconstruct such an evolutionary network, which we term the “net of life.” We use available tree reconstruction methods to infer vertical inheritance, and use an ancestral state inference algorithm to map HGT events on the tree. We also describe a weighting scheme used to estimate the number of genes exchanged between pairs of organisms. We demonstrate that vertical inheritance constitutes the bulk of gene transfer on the tree of life. We term the bulk of horizontal gene flow between tree nodes as “vines,” and demonstrate that multiple but mostly tiny vines interconnect the tree. Our results strongly suggest that the HGT network is a scale-free graph, a finding with important implications for genome evolution. We propose that genes might propagate extremely rapidly across microbial species through the HGT network, using certain organisms as hubs.
Emphasis mine. For more on Dollittle.