
Analyzing the Genome with Statistics
This is the third in a series of articles for the general public focused on understanding how species are related and how genomic data is used in research. Today, we talk about the challenges of using statistics to analyze phylogenomic data.
Suppose you were a door manufacturer trying to figure out the average height of a population living in a certain country. You might conduct an experiment where you ask a group of people to report their height. You would then assemble those measurements in a data set. But in order to study this data set and draw conclusions you would need to analyze it using statistics. For example, how tall should your door be in order to fit 95% of people in the country? How many people do you need to survey to accurately represent the total population? These questions can be answered with statistical analysis.
Because acquiring data from experiments can be costly and time-consuming, we often use small data sets to represent a larger population of interest. In our height experiment, we would not be able to ask every single person in the country his or her height. We would choose a group of people under the assumption that they accurately reflect the population as a whole. However, when we are trying to map out the evolutionary history of organisms using data from sequenced genomes (phylogenomics, which we talked about last time), we need to change our method of analysis.
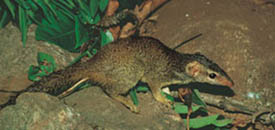
Let’s look at the treeshrew, for instance. It looks like a rodent but actually shares some internal similarities with primates (studied by Sir Wilfrid Le Gros Clark in the 1920s), like brain anatomy and reproductive traits. To figure out if the treeshrew is more similar to rodents or primates, we could sequence its genome and, using statistics, compare its genes to those of rodents and primates. But typical statistical models are based on subsets of populations, while by definition, genomic sequencing gives us a complete data set - all of the treeshrew’s genes. These typical models may not be suitable for interpreting genomic data.
Before reaching a conclusion about the tree shrew, or any set of data, scientists must consider precision and accuracy. Multiple measurements of the same quantity are precise if they are similar to each other. Another way of saying this is that their variance is small. On the other hand, measurements are accurate if they are close to the true value of what they are trying to measure. For genomic data, we need better statistical tools to ensure that the accuracy of our conclusions matches the precision characteristic of these huge data sets.
Larger data sets provide more precise conclusions than smaller ones. For example, when we ask more people to report their height, we are more confident that our sample represents the variability of the actual population. Similarly, we analyze more genes in the treeshrew’s genome to increase our confidence that our conclusion is precise. However, our results might not necessarily be accurate; big data sets may lead us to draw incorrect conclusions with high confidence. The treeshrew’s genome contains some genes that are more similar to rodents’ genes and some that are more similar to primates’ genes (Fan et al., Nie et al., and Xu et al.), and with so much data we could find that the treeshrew is most similar to either group with high confidence. We need analysis tools that will tell us which genes give the correct answer.
Why are conclusions from data sometimes inaccurate? Statistical biases are external factors that produce consistent error in our measurements. Biases have many sources, including faulty experimental design, violation of assumptions made in analyzing the data, and errors in the data collection process. Bias in our height experiment might arise if we unintentionally ask the height of more women than men, causing our estimate of the average height to be lower. But in the case of phylogenomics, we are likely to have biases because of our relative lack of knowledge about the genome: we don’t always know which genes to analyze or the correct way to model the data. For example, some models assume that evolution followed the same pattern throughout all time, but this most likely was not the case.
Furthermore, the process of genome sequencing and analysis itself may create error, especially in the reconstruction of the genome and the alignment of genes for comparison. If we are comparing the genome of the treeshrew to the genomes of primates and rodents, it is difficult for us to know which genes are correlated between species when we are looking at a data set of billions of points. We might use a probability model to determine correlated genes, but all models are at least somewhat incorrect and introduce bias. In smaller data sets, biases are offset by a low precision and relatively small confidence in reaching conclusions. However, in genomic-size data sets, even small biases can be amplified and lead to high confidence in the wrong answer and incorrect phylogenetic trees.
When analyzing phylogenomic datasets, we need to use analyses that are appropriate for large data sets. This will unlock the potential of phylogenomic research to draw unbiased conclusions, like figuring out the correct phylogenetic classification of the treeshrew (still a topic of controversy among evolutionary biologists). However, phylogenomics is such a young field that these tools do not yet exist. When they are developed, we can increase our chances of correctly classifying species’ relationships and discovering the true history of evolution.
For more detail, check out: “Statistics and Truth in Phylogenomics”, Kumar, Sudhir et al. Molecular Biology and Evolution (2011).
References:
Fan, Yu, et al. “Genome of the Chinese tree shrew.” Nature communications 4 (2013): 1426.
Nie, Wenhui, et al. “Flying lemurs-The’flying tree shrews’? Molecular cytogenetic evidence for a Scandentia-Dermoptera sister clade.” BMC biology 6.1 (2008): 18.
Xu, Ling, et al. “Evaluating the Phylogenetic Position of Chinese Tree Shrew (Tupaia belangeri chinensis) Based on Complete Mitochondrial Genome: Implication for Using Tree Shrew as an Alternative Experimental Animal to Primates in Biomedical Research.” Journal of Genetics and Genomics 39.3 (2012): 131-137.
Our next installment will cover some misused terminology in phylogenomics. This series is supported by NSF Grant #DBI-1356548 to RA Cartwright.