
Q and A on phylogeny for the skeptic
Questions by Josh Swamidass, the rest by John Harshman
The most powerful evidence in favor of common descent is what’s called the nested hierarchy of life. Other scientists may have their own candidates for most powerful evidence, and might say that the most powerful evidence comes from within their fields. A paleontologist might point to the fossil record. But I’m a phylogeneticist and I’m writing this, so nested hierarchy it is. Also, since I work with molecular data, I’m going to talk most often about DNA sequences. But what I say applies to all sorts of other data too: proteins, anatomy, behavior, whatever heritable features an organism has.
"Nested hierarchy”, stated most simply, means that species can be organized into a branching tree: species at the ends of the twigs, meeting in branches, that themselves meet other branches, and finally coming down to a meeting of all branches at the root of the tree. Further, the tree represents the actual pattern of branching descent, with each joining of branches representing the common ancestor of all the species above it.
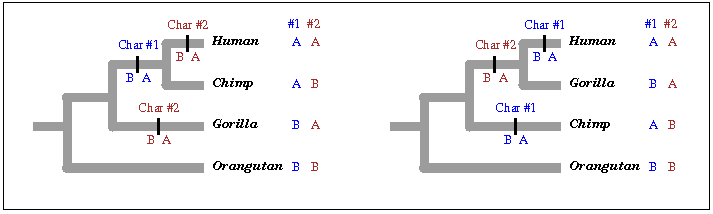
But of course the tree diagram itself is evidence of nothing; you can draw a tree for any combination of species, and in fact you can draw any number of different trees connected in different ways for the same combination. What makes the tree evidence is that you use data to determine the tree, lots of data, and that different samples of data consistently determine a particular tree rather than a bunch of wildly different ones. For example, consider a very simple tree of four species: human, chimpanzee, gorilla, and orangutan. How do we know those species are related by common descent? There are fifteen possible ways to arrange these four species into a tree, and the one supported by most evidence is tree #1 in the figure above.
We also need some way to decide which tree the data fit. I’m going to use a very simple criterion, parsimony. Other criteria are more complex, but the way they are used is the same. Under parsimony, the tree that most simply accounts for the similarities and differences among the species is the one that fits. Consider, for example, the two characteristics (characters, for short) shown in the figure above, character #1 in blue and character #2 in red. Each of them has two possible values, or states, that we name A and B. In the tree at left, look at character #1 (again, in blue); the human and chimp both have the state A, and the gorilla and orangutan share state B. That’s most simply explained by a change in character state, from B to A, happening in one branch of the left-hand tree. But the same character would require two changes to explain the distribution of A and B among species on the right-hand tree. For that reason we say that character supports the left-hand tree but not the right-hand tree. (Character B, the one in red, supports the right-hand tree but not the left-hand tree) If we collect a great many characters and they all support the left-hand tree, that’s good evidence of a true nested hierarchy and thus a true tree of descent.
1. What would it look like for data not to fit the tree?
There are many possible measurements of the fit of data to a tree, and they aren’t all or nothing. Data would fit the tree to a greater or lesser degree, and the degree of fit would not just be to the tree itself but to the tree and the model of change you attach to it. But forgetting all those complexities, let's consider one simple model, parsimony: data fit the tree if they can be explained by the smallest possible number of evolutionary changes. If there are two possible states of a character, as in the figure above, the smallest possible number of changes is one, and the character fits the tree perfectly if only one change is needed to account for the distribution of states in the included species, as the left-hand tree did for character #1. If two or more changes are needed, as for character #2 on the left-hand tree, the character doesn’t fit the tree, or at least not perfectly. Character #2 fits the right-hand tree instead. If we have a large collection of characters, a data set, the data set fits the tree perfectly if each character requires only one change on that tree. If a few characters require two (or even more) changes, the data set fits the tree pretty well. If we look at all possible trees, we say the data fit the left-hand tree if most of the characters are like the character #1, requiring one change on that tree and two or more changes on other trees. If, on the other hand, different pieces of data prefer different trees, with no clear winner, that would show that the data set does not fit the tree.
2. If common descent is true, do we expect violations in the tree in evolution? When and why?
Yes, we do. There are several reasons why characters would be expected not to fit the tree. The simplest is homoplasy: the same state arising twice at different spots on the tree. If changes are randomly sprinkled throughout the genome, we would expect a certain proportion of those changes to happen twice, on different branches of the tree. The resulting pattern of character states wouldn’t fit the tree on which they had actually occurred. Other possible reasons are incomplete lineage sorting and horizontal transfer.
Homoplasy is most likely to happen when branches are long (that is, a long time has passed) and the number of possible states of a character is limited. In DNA sequence data, there are only four possible states of a character: A, C, G, or T. And there’s no way to tell by looking at them whether two A’s resulted from the same ancestral mutation (homology) or two different ones (homoplasy). Worse, changes between A and G or C and T, called transitions, are much more common than other changes, so in the short run, there are more like two states than four. So purely by chance, we expect some homoplasy from common descent. After a long enough time has passed, in fact, the data will have become randomized and will have lost all information about the tree.
A second source of homoplasy is adaptive convergence: two distantly related species in similar environments may find similar adaptations, which might be interpreted by researchers as the same character state. The more complex a character and the more possible different adaptations might serve the same function, the less likely the researcher is to be fooled by convergence. Squid and fish, for example, are streamlined in superficially similar ways, because they are both adapted to minimizing drag in high speed swimming. But the fish swims forward while the squid swims backwards, so no one would confuse those as the same state. In DNA data, a single site might easily converge due to selection, but a long sequence of sites is much less likely to do so.

Another common event is incomplete lineage sorting. Since populations are not uniform but contain genetic variation, some of that variation can be long-lasting enough to be maintained across multiple branchings of species. When that variation is eventually sorted out, as must eventually happen, different species may retain different variations. In such cases, the actual tree of descent of the characters may differ slightly from the tree of the species they reside in and from the trees of other characters.
Incomplete lineage sorting is most likely to happen when branching events (speciations) are close in time to each other, i.e. branches are short, and the population is large. You can think of lineages as pipes in which the frequencies of different character states (alleles) are fluctuating. In the figure above, the top edge of the pipe represents 100% frequency for one allele (represented by gray), and the bottom 100% frequency for the other (represented by white). The jagged line between gray and white is the current frequency at that point in the pipe. If the frequency line hits the top or bottom side, one allele has become fixed (which just means that it has reached 100% frequency). The larger the population, the wider the pipe, and the more time, on average, it takes for the randomly varying frequency to hit either side. If there’s speciation, a branching of the pipe, before one allele is fixed, each new pipe will probably inherit some of each allele. And if there’s a short enough time until the next branching of the pipe, fixation still won’t have happened, and both alleles may be inherited by those new species too. Eventually, one allele will inevitably become fixed in each species, and the different alleles may not reflect the history of the species, though they do reflect the true history of the alleles themselves. In the figure, The white allele is the original allele, inherited by the orangutan. The gray allele begins in the common ancestor of human, chimp, and gorilla, and lasts along with the white allele through two successive branchings of the tree. The gray allele has become fixed in human and gorilla, while the white allele has become fixed in the chimp. The true phylogeny of the gene shown contradicts the true phylogeny of the species it contains, and a tree based on this gene would show humans and gorillas as closest relatives.
A third source of violations of the tree is horizontal transfer, resulting from genetic exchange between species. It’s most common between closely related species whose populations are in contact or from infection by viruses that transfer their genetic material to the host.
So how do we deal with characters that conflict with the tree? If we’re lucky, homoplasy and other sources of conflict are rare and affect few characters. If homoplasy is common but random, different characters showing homoplasy will disagree on what tree to support, leaving the characters without homoplasy to show a consistent signal that stands out from the noise, even if collectively the noise is louder than the signal.
3. Are the species misleadingly cherry picked to match the attributes to minimize homoplasy?
No. The species in phylogenetic studies are picked to answer the questions the researcher is interested in. If you want to know relationships of humans within primates, you pick species from all the various groups of primates, and perhaps a rodent or two for an outgroup. If you want to know whether humans really are primates, you pick species from various other groups of mammals as well as a collection of primates. And generally you don’t know in advance how much homoplasy you will encounter.
There are cases in which you might choose to leave out some species: those at the end of very long branches may have accumulated so much homoplasy that they cause problems for the analysis. Leaving them out is one solution, but another would be to add more species that break up that long branch. However, that’s not always possible, as such species may not exist.
4. Are attributes cherry-picked, such that other attributes would not fit the tree? What is a fair way to pick attributes?
Not usually. Attributes are picked because they show a reasonable amount of variation. If a character doesn’t vary across the tree, it can’t disagree with any tree, and so is useless for a test. If a character varies wildly within species, it doesn’t provide evidence for variation between species. There’s a middle ground that provides the most efficient source of data, enough variation to be useful but not enough to dissolve into noise, and that middle ground may be different depending on what collection of species you want to study. More recent events may be best investigated using fast-evolving DNA sequences such as introns, while very ancient events may be best investigated using amino acid sequences of slowly evolving proteins. Importantly, when choosing a sequence of DNA to include in a data set, we don’t know in advance what tree it will support, and we use all of the sequence we gather, so cherry-picking is unlikely. With anatomical data, cherry-picking is possible, but scientists make every effort to sample a variety of characters so as to avoid this, and again without regard to what sort of tree they might support.