
A tale of two papers
Gerdien de Jong was until her retirement Associate Professor in the Department of Biology at Utrecht University
A tale of two papers
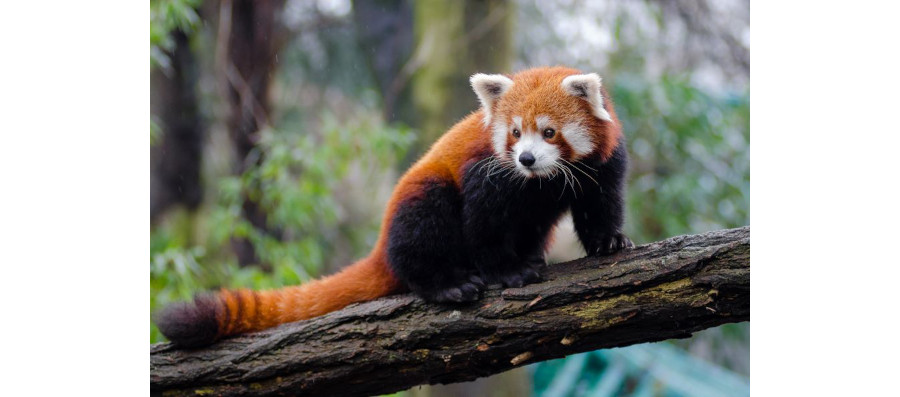
In 2021, dr Matthew / Matyas Cserhati published two parallel articles on the affinities of the red panda Ailurus fulgens, one in BMC Genomics and one in Creation Research Society Quarterly. The two articles are mostly based on the same data and have similar and sometimes identical content.
The BMC Genomics article has the title: “A tail of two pandas – whole genome k-mer signature analysis of the red panda (Ailurus fulgens) and the Giant panda (Ailuropoda melanoleuca)”. This paper concludes that on a whole genome level the red panda possibly belongs to the mustelid (marten) clade. The CRSQ article has the title: “Classification of the enigmatic red panda (Ailurus fulgens) based on molecular baraminology-based analysis”. This paper deems it likely that the red panda belongs to the mustelid holobaramin.
The BMC Genomics paper
Cserhati uses two types of data for the phylogenetic placement of the red panda: Whole Genome K-mer Signature (WGKS) and sequence analysis on mtDNA. Cserhati establishes the frequency spectrum of all possible 8-mer base sequences over the whole genome of a species for 28 species. For each species pair a correlation coefficient over 8-mer frequencies can be computed, leading to a correlation matrix of genomic patterning over the species.
Cserhati uses the correlation matrix to find 4 clusters: the eleven cats, the five bears, the skunk, and a cluster containing the martens and the red panda. But then Cserhati writes: “Based on this evidence, (the red panda) would belong to (the marten family) as a monophyletic group.”
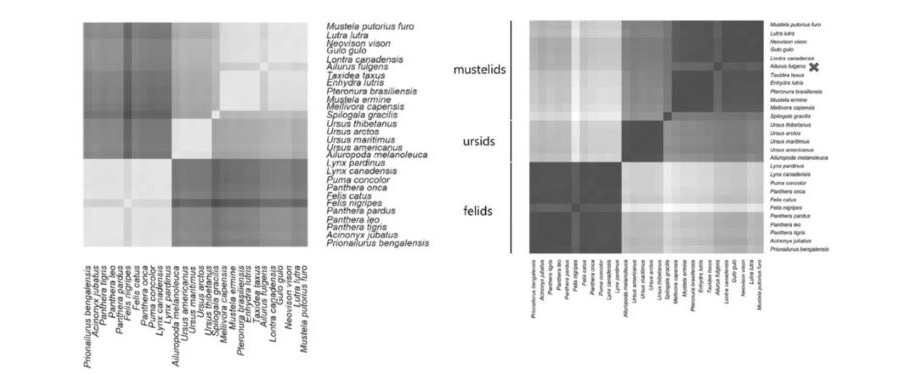
Here the article derails. The clustering can be regarded as evidence that the red panda and the marten family are monophyletic sister groups, but not that the red panda belongs to the marten family. The red panda has a lower mean correlation with the marten species than the mean correlation of the marten species amongst each other, showing a clear distance between panda and martens. This difference is significant (P < 1.4 x 10⁻⁶) but Cserhati writes “This difference is not too significant”, and he decides to ignore it. In his heat map of the correlation matrix the difference between red panda and marten species is clearly visible: left figure on top, lighter is higher correlation, and the red panda gives the top right ‘Finnish flag’ pattern.
The mtDNA sequences of 52 species/subspecies of bears, skunks, raccoons, martens, and both subspecies of the red panda are aligned and clustered. Cserhati finds 5 clusters: the 15 bears, the 30 martens, the two panda sequences, the two skunks and the 3 raccoons, clearly finding the traditional families. The mtDNA sequences are subjected to phylogenetic analysis by UPGMA, Maximum Likelihood and Neighbour Joining. No outgroup is mentioned, and no outgroup seems to have been specified.
The three phylogenetic trees on mtDNA differ in the placement of the families. The mess seems the result of the lack of outgroup. When plotting an unrooted tree in a square format, the program picks the plot. The pandas do not appear within the marten family in any of the three phylogenetic trees.
Cserhati gives his preferred conclusion: “The main conclusion … is that on a whole genome level (the red panda) possibly belongs to the (marten) clade”. Nowhere in his analyses does the red panda appear within the marten group. At most we see a monophyletic group of the marten and panda families. Cserhati conflates monophyly and belonging to the same family.
One problem: how did a paper as bad as this ever get through review and published?
Creation Research Society Quarterly paper
Cserhati bases the search for the baraminological placement of the red panda on three types of data: Whole Genome K-mer Signature (WGKS), sequence analysis on mtDNA and sequence analysis on cytochrome-b.
The WGKS part is the article is almost identical to the WGKS paragraph in the BMC Genomics paper. The same heat map of the WGKS correlation matrix is presented, but the coloring is reversed: right top figure, darker is higher correlation, and the red panda gives the top right ‘Danish flag’ pattern. Again it is visible that the correlation between red panda and martens is lower than the correlations amongst the martens, and again the significant difference is dismissed. The red panda is held to belong to the marten holobaramin.
The mtDNA sequences of the same 52 species as in the BMC genomics paper were aligned and the resulting identity matrix showing global sequence similarity was visualized in a heat map. This heat map clearly shows five main groups representing the traditional families: two red panda subspecies, bears, marten family, the three skunks and the two raccoons. The two red panda subspecies form an independent cluster.
The cytochrome-b sequences of a total of 51 cat, bear, marten, raccoon and skunk species were aligned. The heat map of the similarity matrix shows a clear split between the cat species and all other species, in line with classical systematics. The red panda does not cluster with the marten family according to the heat map.
Again the data do not support including the red panda in the marten family. Yet, Cserhati judges that the panda belongs to the marten holobaramin. Of course, Cserhati might define a holobaramin containing two families, the marten family and the red panda family.
As in all baraminological literature, statistical clustering to different clusters is assumed to indicate unbridgeable biological discontinuity. The reasoning obscures the discontinuity between biology and statistics.
Strategy
A Dutch creationist website that recommends Cserhati’s work on the red panda wrote:
Cserhati’s work can stand as a model for how to do creation research. First, find funding for a detailed study within the creation paradigm (here, Creation Research Society Grant #62). Second, publish the results in a standard naturalistic science journal. Then, provide a more detailed study in a creation science journal.
That is, play the system, aiming for respectability for creationist writing.