
Ark attendance weak, at best
William Trollinger, on the blog Righting America, presents what he calls a few facts about Ark Encounter attendance and deems that attendance to be Not Even Close to What Was Projected. Dr. Trollinger bases his conclusion on data acquired by the indomitable Dan Phelps, an occasional guest contributor here at PT. Mr. Phelps each month uses the Kentucky Open Records Act to ascertain the monies collected by the city of Williamstown from the safety fee of $0.50 added to each ticket. From these data it is easy to deduce the number of tickets sold and therefore the number of patrons in any given month, apart from a number of possibly fictitious season-pass holders who pass the ticket window without being assessed the safety fee.
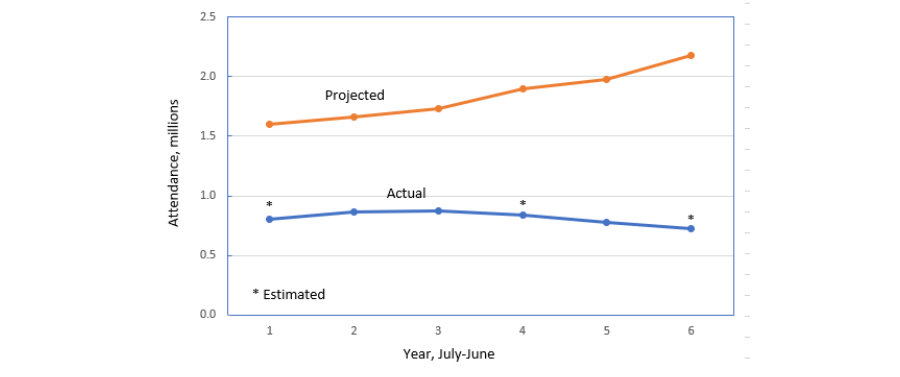
I have graphed Dr. Trollinger’s data and show them as the frontispiece to this article. Two of the years, as noted, are estimates. Year 4 is actually a two-year period from July 2019 to June 2021, but with March 2020 through February 2021 omitted because of the Covid pandemic. The result does not seem out of line. Overall attendance, over the 6 years, is about 40 % of projected attendance and appears to have fallen somewhat since Year 3, as projected attendance rises.
For that, as Dr. Trollinger notes, Williamstown issued $62 million in junk bonds and in effect forwent a significant sum in property taxes. For more details, see the original article.