
Flagellum evolution kerfluffle continued
As the discussion over the Liu-Ochman flagellum evolution paper continues, it is clear that I need to do a little more arguing to defend my position. Although some were convinced that skepticism was justified based the previous PT posts (basically: 1. this goes against much prior published knowledge and 2. just look at the obviously different structures), others have defended the paper or at least suggested that the alleged problems are not as overwhelmingly obvious as they seem to me. Two primary lines of argument have been raised. First, some have pointed out, correctly, that the reputation of the authors and journal in question far outweighs the reputation of a blogger like me, so why should readers trust me over PNAS? I will concede the case when it comes to reputation; all I can say is that over the years I have developed some familiarity with the literature pertinent to flagellum evolution, and as I read through the PNAS paper it became apparent that it was going against much of what was already known. This is not necessarily bad if a direct attempt is made to rebut conventional wisdom, but if assertions are made without much evidence of awareness that they go against previous work, that is problematic.
Second and more importantly, the Liu-Ochman paper reports reasonably significant e-values (e < 0.0001) for their claimed homologies (all of the lines in Liu-Ochman’s Figure 3 represent matches with e-values of 0.0001 or less, in one or more of the 41 bacterial genomes they searched). I have been hinting that there are more technical problems with the paper, and that I and some others are working on a more detailed critique. For the moment – especially to forestall suggestions that we are ignoring Liu and Ochman’s BLAST results, and that we don’t know how BLAST statistics work, etc., I will post some preliminary results of an attempt to replicate Liu and Ochman’s findings.
A little background on BLAST, e-values, and homology
BLAST stands for Basic Local Alignment Search Tool, a standard program in bioinformatics that is used to find statistically significant matches between two sequences (amino acid or DNA). It is implemented in numerous web applications that can search massive online databases, and in stand-alone executables that can search local or online databases.
Homology is similarity due to common ancestry. In proteins and DNA, this is typically sequence similarity. As a very rough guide, for protein amino acid sequences, sequence similarity of 30% or more is typically strong evidence of homology, sequence similarity of 20-30% is the “twilight zone” where the assignment of homology typically becomes uncertain, and sequence similarity below 20% can often be due to chance resemblance. (Various details make this picture more complicated, e.g. shorter proteins need higher similarity to confidently assign homology.)
Structure is more conserved than sequence. It has been repeatedly observed that proteins down to 30% or 20% similarity will commonly exhibit very similar tertiary structure and folds. There are ways for mutations to change structures so this is not a universal rule, but it is a very good generalization. Homology will often be assigned based on detailed structural similarity and weak sequence similarity. It is thus suspicious if a claim of significant sequence similarity is contradicted by the observation of no structural similarity.
Along with alignments, BLAST produces an e-value statistic, which is a better statistical measure of the significance of an alignment than percent similarity. The e-value represents the number of times that a given sequence match of a certain length and strength would be expected by chance, given a database of a certain size. (“e” is for “expected”) The larger the database, the more likely it is that a weak match would occur by chance. An e-value of 1 indicates that one match of similar length and strength or better would be expected by chance, and therefore the match is clearly not significant. There is no hard and fast line for significance, and the e-value is not an infallible statistic anyway, but the rules of thumb seem to be that e-values less than 0.01 are interesting, and e-values less than perhaps 10-8 or so are almost always a good indicator of homology, assuming no human error. Very close matches – 50% or more sequence in common – can have e-values of 10-30 or less. Identical proteins, e.g. a protein BLASTed against itself, will have an e-value of 0.
An attempt to replicate the homology hits in Liu and Ochman (2007)
Recall Liu & Ochman’s Figure 3:
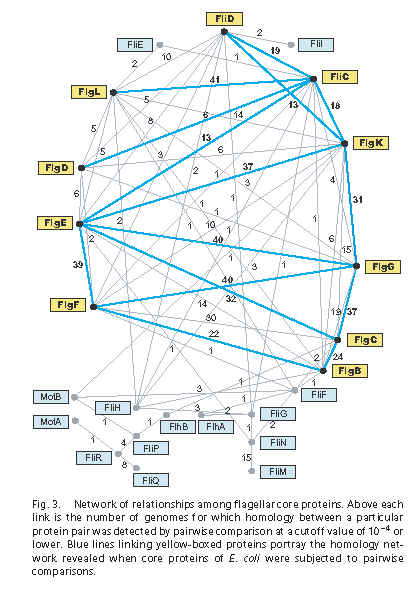
The lines represent alignments that are significant according to an e-value cutoff of e = 0.0001 or less. The numbers represent the number of genomes (out of 41) where the homology connection was reported. The blue lines represent the matches found specifically in the E. coli K12 genome. According to Figure 3, FliC is homologous to FliD (cap protein), FlgD (rod), FlgE (rod), FlgK (adapter between hook and FlgL), and FlgL (adapter between FlgK and FliC). Homology between FliC and FlgL seems to be well-accepted and retrievable with PSI-BLAST (a search more sensitive than regular protein BLAST), but the others are novel, or at least it is novel to claim that a simple BLAST search can detect them with decent significance.
I and others have been attempting to replicate the results in Figure 3. According to the paper’s methods, Figure 3 is based on pairwise comparison using the executable bl2seq (BLAST 2 sequences). The bl2seq executable can be downloaded from the NCBI here. (I got blast-2.2.10-ia32-win32.exe to work on my 2004 windows32 PC; you will have to download other versions for other machines and operating systems.) The bl2seq documentation is online here. According to Table 1 of the paper’s Supplementary Material, the E. coli genome was E. coli K12, NC_000913.2, which is online here. I downloaded the FASTA-format sequences for the 24 “core” flagellar proteins that the authors identified; I have uploaded them here (right-click to download) as a zipfile if you would like them.
The table below shows the search results for BLASTing FliC against the 24 flagellar proteins. The table columns, from left to right, contain:
- 1. Protein name
- 2. Liu-Ochman matches to FliC (from Figure 3)
- 3. e-values for bl2seq search default filters off
(example search: bl2seq -p blastp -F F -i FliC.fasta -j FlgD.fasta -o FliCvFlgD.out) - 4. e-values for bl2seq search default filters on
(example search:bl2seq -p blastp -i FliC.fasta -j FlgD.fasta -o FliCvFlgD_filters.out) - 5. e-values for bl2seq, default filters on, database size = 7163
(example search: bl2seq -p blastp -i FliC.fasta -j FlgD.fasta -o FliCvFlgD_filters_db7163.out -d 7163) - 6. e-values for bl2seq, default filters on, database size = 293683
(example search: bl2seq -p blastp -i FliC.fasta -j FlgD.fasta -o FliCvFlgD_filters_db293683.out -d 293683)
Although the methods section of Liu & Ochman (2007) says that the bl2seq BLAST searches were run with defaults (basically column #4 in the table below), it is apparent that the BLAST searches were actually run in the non-default setting of filters off (column #3). Through the grapevine I have heard that the authors are telling correspondents about this error in email, and plan to issue a correction, which is good.
An additional issue is database size. Searching 23 proteins instead of one means that the database size is not the size of one protein, but the size of all 23 proteins strung together, or 7163 amino acids in length. Furthermore, the authors actually ran these pairwise searches between the 24 core proteins in each of 41 genomes, so the full size of the database searched is actually approximately 7163 x 41 = 293683. Columns 5 and 6 show the resultant e-values when bl2seq is run with the -d (database size) parameter set at these values.
Table: e-values resulting from bl2seq search of E. coli K12 FliC against 23 other core flagellar proteins, using different search options. ns = no significant hit according to Figure 3 of Liu and Ochman (2007). na = no significant alignment returned by bl2seq.
| Protein | Liu-Ochman hits for E. coli K12 (Figure 3) | default filters off | default filters on | default filters on, database size = 7163 | default filters on, database size = 293683 |
| FlgB | ns | 0.2500 | 0.2500 | na | na |
| FlgC | ns | 0.3200 | 2.1000 | na | na |
| FlgD | <0.0001 | 0.0003 | 0.0110 | 2.3000 | na |
| FlgE | <0.0001 | 4e-06 | 0.0110 | 0.2100 | na |
| FlgF | ns | 0.0120 | 0.0120 | 0.3500 | na |
| FlgG | ns | 0.1700 | 0.6600 | na | na |
| FlgK | <0.0001 | 2e-10 | 3e-05 | 0.0100 | na |
| FlgL | <0.0001 | 4e-09 | 0.0250 | na | na |
| FlhA | ns | na | na | na | na |
| FlhB | ns | na | na | na | na |
| FliD | <0.0001 | 9e-09 | 7e-06 | 0.0080 | 8.0000 |
| FliE | ns | na | na | na | na |
| FliF | ns | 0.0350 | 0.0350 | 0.4600 | na |
| FliG | ns | 0.8600 | 0.8600 | na | na |
| FliH | ns | 1.7000 | 1.7000 | na | na |
| FliI | ns | 1.2000 | 1.6000 | na | na |
| FliM | ns | na | na | na | na |
| FliN | ns | 0.2500 | 0.2500 | na | na |
| FliP | ns | 5.2000 | 5.2000 | na | na |
| FliQ | ns | na | na | na | na |
| FliR | ns | na | na | na | na |
| MotA | ns | na | na | na | na |
| MotB | ns | 0.6100 | 0.6100 | na | na |
As you can see, with default filters turned on, 5 significant hits become only 2. With filters on, plus database sizes larger than a single protein, no hits are significant.
Removing filters from a BLAST search is an extremely serious decision with major impacts on an analysis, because the filters prevent spurious matches that are due to similarities that are not phylogenetically informative, such as low-complexity regions and biases in amino acid composition. Similarly, the database size has a massive impact on e-value.
We have not yet run the same searches systematically through the other flagellar proteins and the other 40 genomes, but it is apparent that the results would be similarly dire, and that most or all of the new significant hits reported in Liu and Ochman’s Figure 3 would evaporate. Thus the only support for the all-flagellum-genes-from-one hypothesis, which was unlikely from the beginning based on background information, also evaporates.
Acknowledgements
Doug Theobald and Ian Musgrave ran some of these searches before me, and Doug educated me on the database size issue and made various other helpful comments. Any errors are of course mine.
Note: The FliC-FlgD match in Column 3 has an e-value of 0.0003, which is actually higher than the 0.0001 cutoff. So either there is a slight difference in our databases or techniques, or 0.0003 was mistakenly reported as a hit below 0.0001 in Figure 3.